Most people know about the benefits of Google Analytics. However, few are aware of all the kinds of data one could obtain from this powerful (and free) engine to improve conversion rate.
The new version, Google Analytics 4 (GA4), has greatly simplified things, allowing brands to integrate web and app data into one stream. That means websites can concurrently track incoming data across devices.
The entire user interface of GA4 is different and represents the users’ experience rather than the owners’. Websites can intuitively identify the areas that require improvements from users’ perspective and make changes where applicable.
For example, websites can track how and where visitors are coming from on the user acquisition page, including country, source category, the origin of traffic, and LTV (lifetime value). GA4 will sum up purchase events and, if the business has mobile app ad placements, it can estimate AdMob earnings too – for the first 120 days a user uses the app or website. Then it averages out the LTV based on all user data.
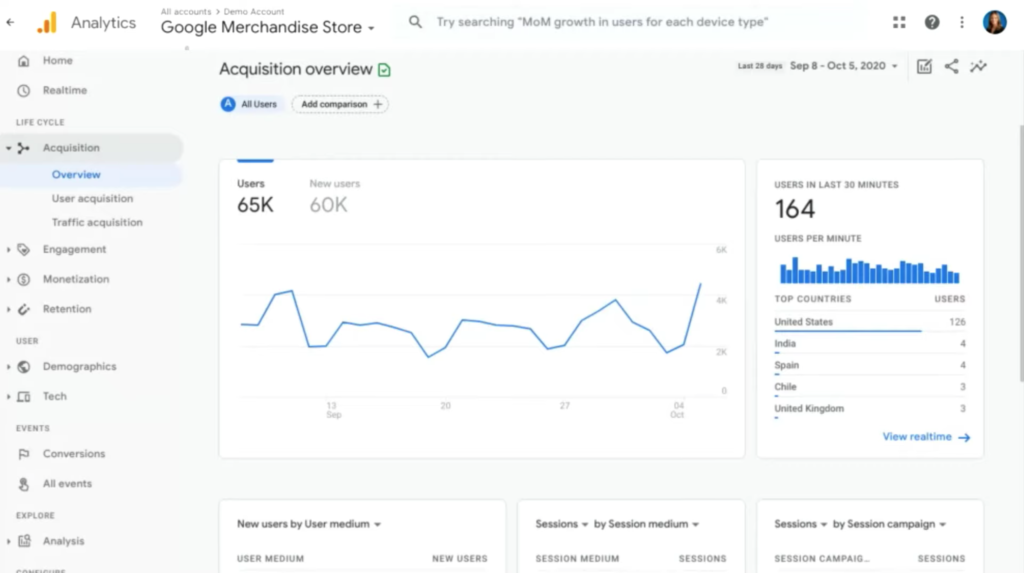
Engagement
A key feature or section for brands is the improved engagement interface.
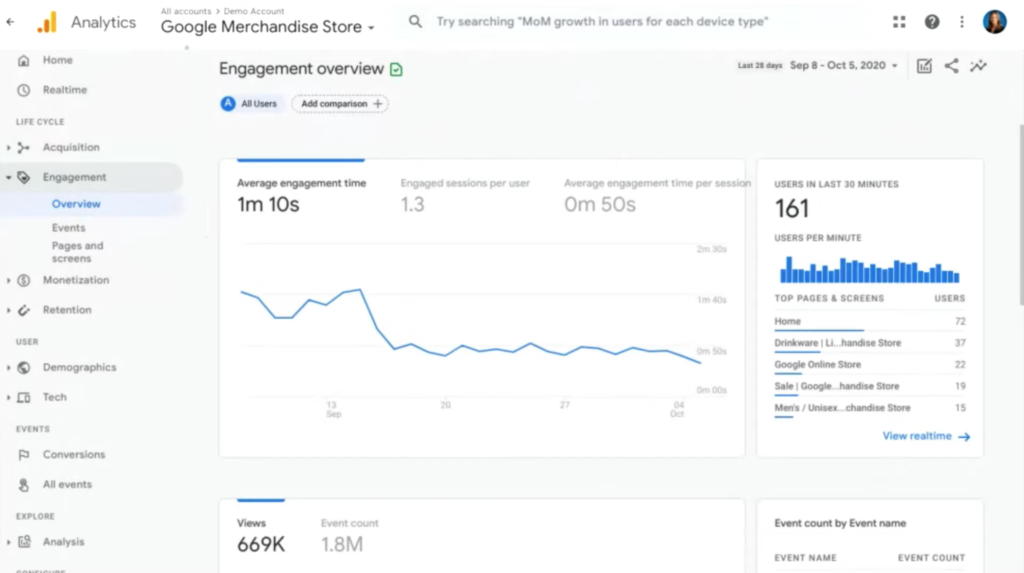
Knowing how much time people spend on the site and which pages they visit is essential. It can help understand what part of the shopping or sales process is most problematic, confusing, or off-putting to potential customers.
On the engagement page, businesses can also view event counts per user, allowing them to see exactly what each person is doing while on the website or app. For example, a new user may have the following events to help indicate activities on a given page.
- first_visit
- page_view
- scroll
- session_start
- user_engagement
For web pages, GA4 separates page views by page title, which is one of my personal favorite features on the engagement section. It helps with identifying top-performing or key pages, where changes need to occur, and other debacles without having to look at tons of URLs. We can customize reports in GA4 by comparing other dimensions (e.g., age, city, gender, etc.) and attribution types (e.g., last engagement or last click).
Additionally, some engagement metrics available on Universal Analytics were replaced with new ones in GA4. Specifically, bounce rate, time on page, and bounces were replaced with engagement rate, engaged sessions, and engaged sessions per user.
Monetization
The monetization overview in GA4 is a replacement for eCommerce reporting and is pretty self-explanatory. While necessary for business planning, the monetization overview doesn’t factor as much into the CRO process.
Demographics
The demographics tab, on the other hand, is where Google Analytics 4 will shine. With a click of a button, websites gain access to a detailed overview of page visits, filtered by countries, cities, gender, interest, or age.
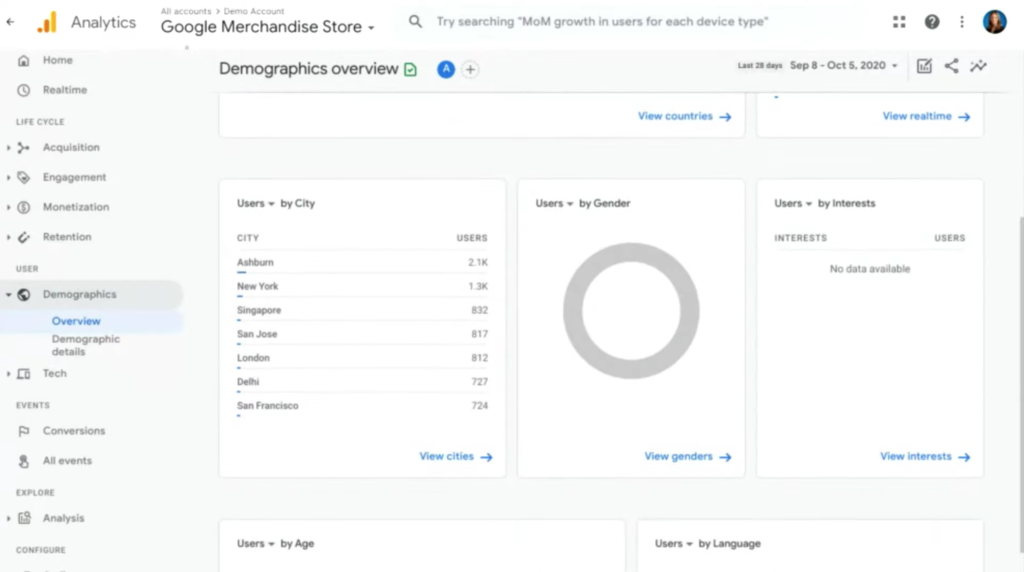
Businesses can also enhance demographics data by turning on Google Signals. It’s an advertising feature in GA4 that allows the platform to collect cross-device data from users who are signed in to a Google account. The feature is not active by default but once activated, it can improve data tracking accuracy and remarketing.
Here’s how to turn on Google Signals.
- Go to ‘Admin’, located on the lower part of the left navigation menu in GA4, and click ‘Data Settings’.
- Then, click on ‘Data Collection’ and navigate to ‘Enable Google Signals Data Collection’ to proceed.
Companies will know what demographics are sufficiently attracted to products and which users to focus on next. With such information, developing a customized marketing campaign or adjusting the website to please preferred groups becomes easier – allowing the brand to achieve a better conversion rate in the long run.
Demographics data example with Google signals turned on:
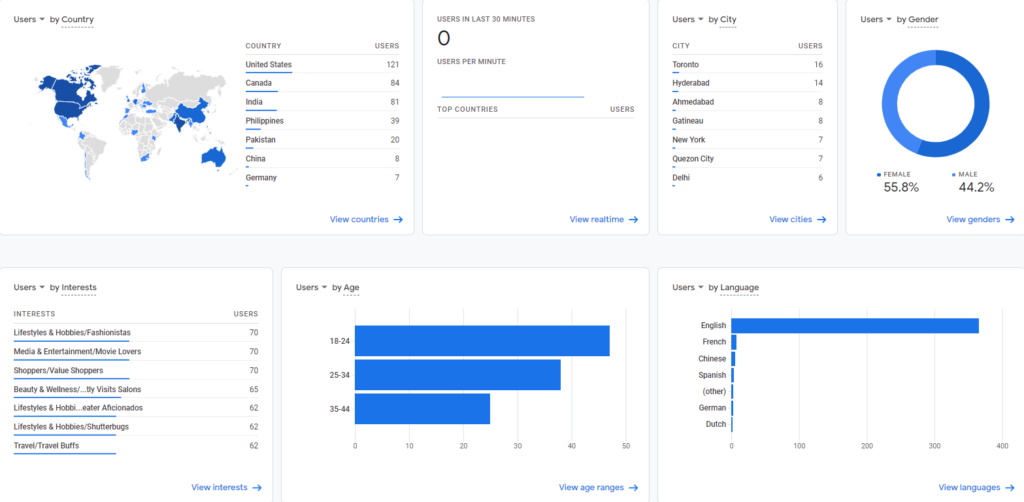
Image provided by Tech Help Canada.
Technology
The new tech overview in GA4 can play a vital role in how brands design the user experience. It’ll show information concerning the platforms where data comes from, including device, operating system, and browser types.
Nowadays, more users turn to mobile devices to browse or get things done, so the GA4 tech overview should reflect that change. If the percentage of users accessing the website through iOS or Android devices is lacking, the brand should strongly reconsider the mobile site design. Maybe develop a more user-friendly or accessible site.
Worth noting is that some websites or platforms can only function on desktop devices due to the application or use cases. But that’s not the case for most brands – success greatly depends on being accessible on multiple devices.
Events
The events section in GA4 will probably be the most vital area to observe for businesses. With an improved interface, setting up events became slightly easier, and reviewing each requires a click of a button.
Businesses should focus on events that form a chain of user experiences from the start (first visit) to finish (a successful purchase). To that end, GA4 has specifically added Conversion events in a separate overview to make matters easier.
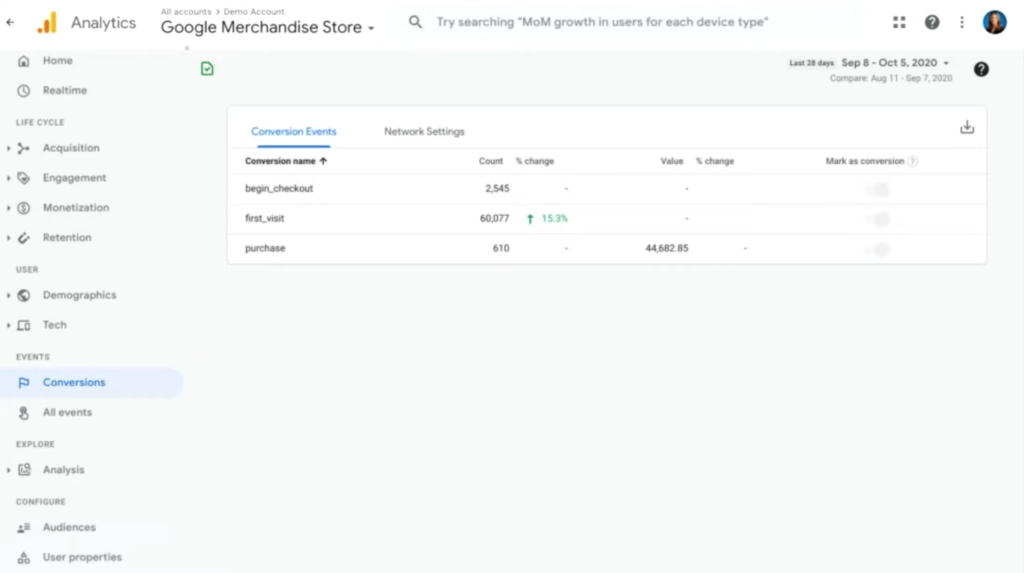
Under the ‘Conversions’ tab, brands can see all events that classify as conversions. They can create new conversion events or make auto-generated events into conversions by visiting the ‘All Events’ tab. The business can also modify all auto-generated events. Identifying where customers stop shopping in the chain of experiences will inform how brands approach improvements.
Analysis
Google Analytics 4 also came with an updated Analysis tab, which provides new reports that are easier to digest with detailed data. Brands can use specific analysis report templates for different focus points, such as acquisition, conversion, or user behavior.
Additionally, the machine-learning-oriented design has allowed Google to add many new insights and predictions reporting. With that, brands can attempt to see into the future to possibly predict conversion rates and customer experience based on past trends, including settings.
While machine learning is generally considered a more experimental approach to business direction, don’t underestimate AI’s power. Especially considering the colossal data sets Google has at its disposal.
Final Thoughts
As a final note regarding GA4, since it’s still a new product, I’d recommend tracking data with Universal Analytics and GA4. That way, the team can get familiar with GA4 without disrupting current settings. It also provides the best of both products, allowing brands to continue using existing features and have access to new ones.

Gabriel Nwatarali is a copywriter, SEO expert, and the founder of Tech Help Canada. He helps founders attract the right kind of search traffic through SEO strategy, content that ranks, and conversion-focused copy. In one project, a single copy tweak helped a brand increase downloads from a few hundred to 10M+. Want a second set of eyes on your site? Reach Out Here
Want a heads-up once a week whenever a new article drops?


