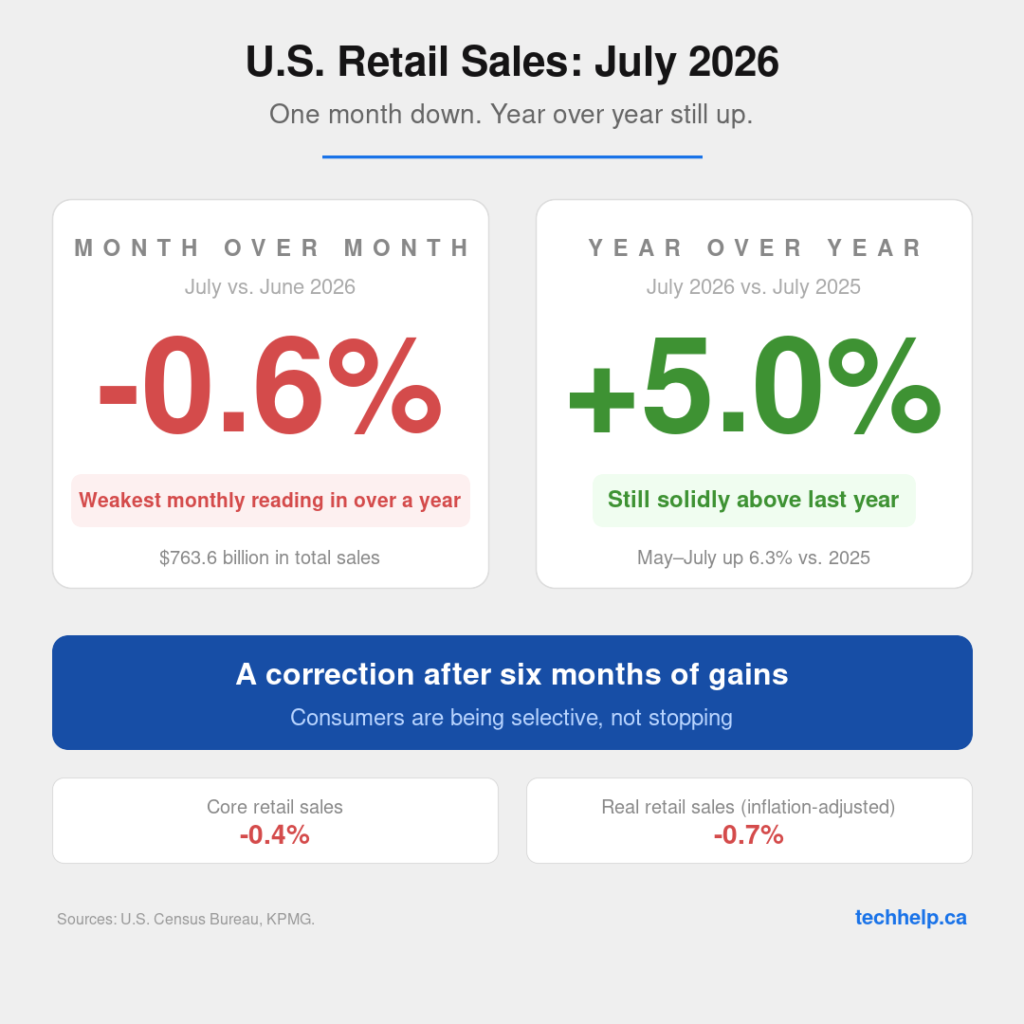
U.S. retail and food services sales fell 0.6% in July, according to the Census Bureau’s August 14 advance report.
Sales came in at $763.6 billion, down from a revised $768.1 billion in June. That is a clear pullback, especially after months of stronger spending. But it is not a consumer collapse. Sales were still 5.0% higher than July 2025, and the May-through-July period ran 6.3% above the same stretch last year.
For business owners, the useful signal sits in the category split. Some purchases are getting delayed, downgraded, or pulled forward by promotions. Other categories are still finding demand.
That split affects how you sell, price, manage inventory, and plan ad budgets heading into the fall.
The headline number was weaker, but not disastrous
The July decline was the weakest monthly reading in more than a year, according to KPMG’s analysis of the Census data. Sales excluding autos fell 0.3%, and core retail sales, which exclude autos, gasoline, restaurants, and building materials, fell 0.4%.
There is another layer here: Census retail estimates are adjusted for seasonality, but not for price changes. KPMG estimated that real retail sales fell 0.7% in July after inflation rebounded from June.
So yes, shoppers spent less in July. They also faced higher prices in several areas, which means the pressure was stronger than the headline number alone suggests.
Still, one month does not erase the broader trend. The year-over-year numbers are positive. The more useful read is that consumers are becoming more selective.
The categories that pulled back
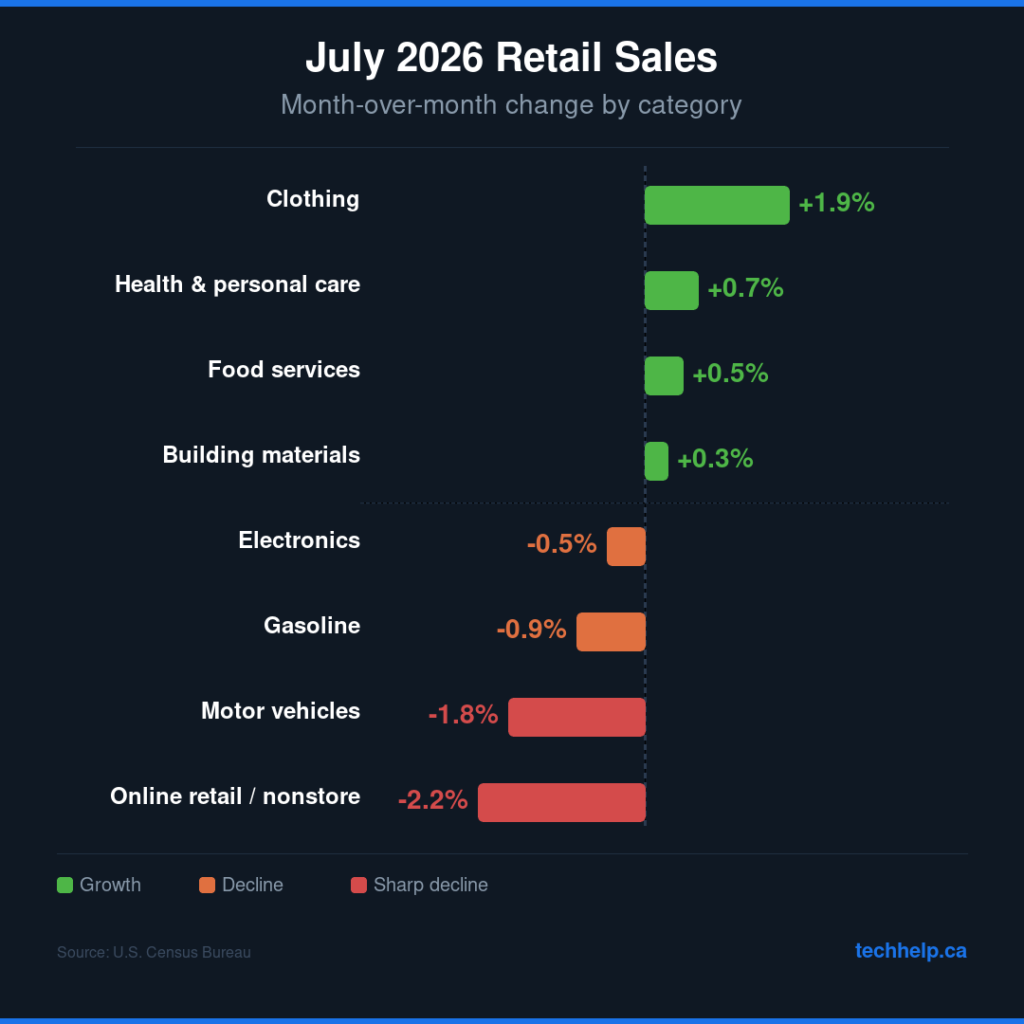
Nonstore retailers, the category that captures most e-commerce sales, fell 2.2% from June. That was the steepest drop among the major categories in the Census report.
That does not mean online shopping is suddenly weak. Nonstore retail was still up 7.7% from July 2025. KPMG attributed the monthly drop partly to June promotions from major online retailers pulling sales forward, leaving July with less immediate demand.
Motor vehicle and parts dealers fell 1.8%, reversing much of June’s 2.4% gain. KPMG pointed to rising parts and maintenance costs tied to tariffs, higher input costs, and used cars needing more maintenance. New vehicle purchases are also becoming more concentrated among higher-income households.
Gasoline stations fell 0.9% on a nominal basis. KPMG estimated sales actually rose about 2% after adjusting for lower pump prices. That distinction is useful because it shows how energy can distort the spending data. Al Jazeera has reported renewed oil-market pressure around the Strait of Hormuz, a route that carries about one-fifth of global trade in oil and liquefied natural gas during normal conditions.
Electronics and appliance stores slipped 0.5%. KPMG connected the weakness to rising electronics prices, chip shortages, and possible input pressure if energy-market disruptions continue.
Those categories all tell the same general truth: big-ticket, price-sensitive, and supply-chain-exposed purchases are under more pressure.
The categories that still found demand
Clothing and accessories rose 1.9% in July, the strongest monthly gain among major Census categories.
Part of that may be tied to a broader shift in apparel demand. Circana reported that U.S. household GLP-1 medication usage reached 23% as of September 2025, and 80% of GLP-1 users expected to need new clothing because of size changes. Circana also found that 55% of active GLP-1 users had already purchased new clothing or footwear.
That does not explain the entire clothing gain. It does show why apparel is worth watching. Fit, sizing, replacement demand, and changing personal style can create spending pockets even when the broader consumer is more cautious.
Health and personal care stores rose 0.7%. Food services and drinking places rose 0.5%. Miscellaneous retailers rose 0.5%. Building materials, furniture, and general merchandise stores each rose 0.3%.
Sporting goods, hobby, musical instrument, and book stores were flat for the month, but up 10.1% from July 2025.
The spending pattern is not random. Consumers are still buying, but they are choosing more carefully. Categories tied to health, appearance, selective recreation, dining, and practical household needs held up better than categories where purchases can be postponed.
Why shoppers are getting more selective
The July pullback did not come from one cause.
KPMG said the second quarter had been lifted by a surge in tax refunds. Once that cash worked through the system, the spending pace cooled.
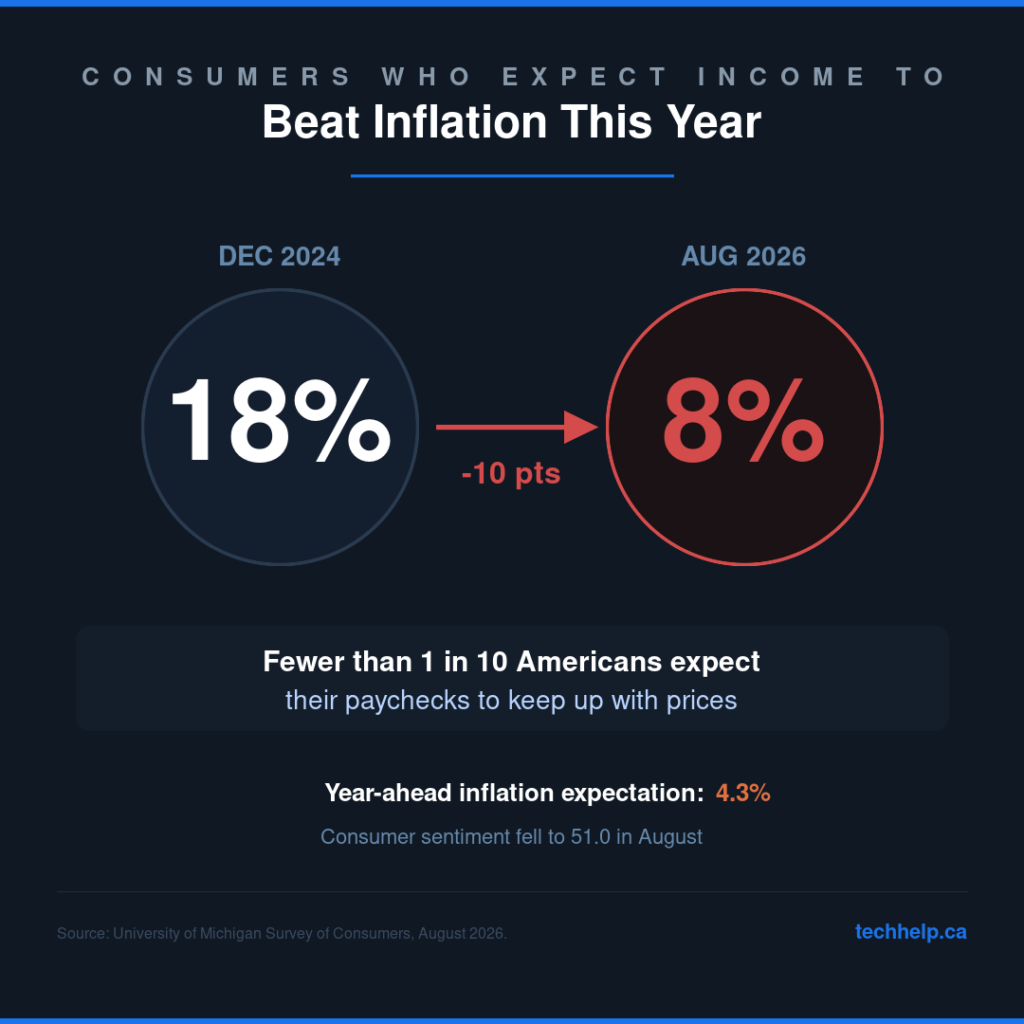
Consumer confidence also weakened. Quartz reported that the University of Michigan’s preliminary August consumer sentiment index fell to 51.0 from 55.2 in July. Expected business conditions dropped for both the short and long run, and only 8% of consumers expected income growth to outpace inflation over the next year.
Tariffs are adding pressure too. The Federal Reserve Bank of New York’s Liberty Street Economics found that about 80% of goods and retail firms reported passing at least some higher imported input costs to customers, while about 60% absorbed some of those costs internally.
That combination is painful for small businesses. If customers resist higher prices and suppliers keep raising costs, margin gets squeezed from both sides.
Do not build your fall plan around cheaper borrowing
Some business owners may be hoping lower rates will soften the blow. That is not a plan worth relying on.
KPMG said many Federal Reserve officials are moving in a more hawkish direction, though the timing of any rate hike remains uncertain. Its economics team still expects two interest-rate hikes in the second half of 2026.
For business owners, the practical takeaway is simple: do not assume credit will get cheaper before your next inventory order, equipment purchase, or expansion decision.
If borrowing costs stay high or move higher, customers with credit card debt, auto loans, or home equity lines will feel that pressure too. That tends to hit big-ticket and discretionary categories first.
How business owners should read the July report
The July data says consumers are still in the market, but not equally across every category.
Fiserv’s July Small Business Index found that small business sales rose 1.6% year over year, driven by higher average transaction values as foot traffic declined. That is an important warning. Growth built on larger tickets can look healthy until traffic weakens enough to offset it.
NFIB’s July report also showed a mixed small business picture. Its optimism index rose to 99.8, above the 52-year average, but 36% of owners reported job openings they could not fill. Inflation ranked as the third-biggest business problem, even after improving from June.
So the operating environment is not simple. Customers are selective. Labor is still hard to secure. Input costs are not settled. Borrowing relief is uncertain.
If you run a business, this is the moment to tighten your read on demand.
Watch average order value and transaction count separately. If revenue is holding because fewer customers are spending more, that is different from broad demand growth.
Protect margin before discounting. Bundles, tiered offers, smaller entry-level packages, and clearer value comparisons can work better than across-the-board price cuts. If your pricing structure has not been reviewed lately, this is a good time to revisit your pricing tiers.
Segment your customers by pressure level. Lower- and middle-income households may respond to value, predictability, and smaller purchase commitments. Higher-income customers may still spend, but they are becoming more selective.
Plan inventory around categories that still have momentum. Clothing, health and personal care, dining, selective recreation, and practical household categories are behaving differently from autos, electronics, and gasoline-sensitive purchases.
Build a buffer into fall costs. Energy, tariffs, shipping, and labor can all move against you at the same time. It is easier to read those trade-offs early than to adjust after margins are already under pressure.
The July retail report is a warning against lazy averages. A 0.6% decline tells you the market slowed. The category data tells you where customers are still reachable.
That is the part a business can act on.
Frequently Asked Questions
Did U.S. retail sales fall in July 2026?
Yes. The Census Bureau reported that U.S. retail and food services sales fell 0.6% in July 2026 to $763.6 billion. Sales were still 5.0% higher than July 2025.
Which retail categories fell the most in July?
Nonstore retailers fell 2.2%, motor vehicle and parts dealers fell 1.8%, gasoline stations fell 0.9%, and electronics and appliance stores fell 0.5%.
Which retail categories grew in July?
Clothing and accessories rose 1.9%, health and personal care rose 0.7%, food services and drinking places rose 0.5%, and several household-related categories posted smaller gains. Sporting goods, hobby, musical instrument, and book stores were flat for the month but up 10.1% from July 2025.
Does the July retail report mean consumers stopped spending?
No. The report shows a more selective consumer, not a vanished consumer. Some categories weakened, while apparel, health, dining, and practical household spending continued to grow.
Why did U.S. retail sales fall in July 2026?
Retail sales fell because several pressures hit at once. June promotions pulled some online demand forward, motor vehicle sales weakened, the tax-refund spending lift faded, consumer sentiment slipped, and tariff-related costs kept pressure on prices.
What should small businesses do after the July retail sales report?
Business owners should track transaction count and average order value separately, protect margin before discounting, review pricing tiers, watch category-level demand, and build cost buffers before the fall selling season.
Get new small business insights by email
Practical ideas and useful articles to help you make better business decisions.
Tech Help Canada Staff researches, writes, and reviews practical content for business owners and professionals. Our coverage spans business, marketing, SEO, technology, and the tools and systems people use to grow and operate online. We focus on clear, useful information backed by research, hands-on experience, and editorial review. Learn more about our team and editorial standards. Need help with something? Contact Us