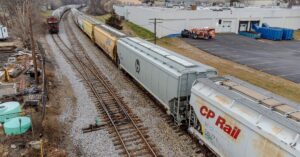
Rail fuel surcharges on grain shipments are sitting at record-high levels, tightening freight math during the opening stretch of fall harvest and adding another cost pressure to farm margins.
The U.S. Department of Agriculture’s Sept. 10 Grain Transportation Report put the North American weighted-average railroad fuel surcharge for grain at 48 cents per railcar-mile in September. That was unchanged from August, but 29 cents higher than September 2025 and 28 cents higher than the prior three-year September average.
Reuters, using USDA data, reported that the rate was 153% above the weighted average from a year earlier and at record levels for grain shipments. The increase matters because grain freight is priced into local cash bids, export offers and processor costs long before it appears in a consumer-facing food-price measure.
Diesel is feeding directly into rail freight bills
Fuel surcharges are added on top of base rail tariffs. Reuters reported that many rail surcharge programs are tied to the U.S. On-Highway Diesel Fuel Index and are triggered once diesel reaches carrier-specific thresholds, with the surcharge rising as the index rises.
The diesel index has moved fast. The U.S. Energy Information Administration listed average U.S. No. 2 diesel at $6.285 a gallon for the week of Sept. 14. One week earlier, the USDA’s Grain Transportation Report said the Sept. 7 diesel price of $5.967 had already surpassed the previous EIA weekly record of $5.810, set on June 20, 2022.
At 48 cents per railcar-mile, a simple 1,000-mile grain move would carry $480 in fuel surcharge per car before the base tariff. A 110-car shuttle train would carry $52,800 in fuel surcharge alone. Actual invoices vary by railroad, route, car ownership, train type and contract terms, but the arithmetic shows why a few dozen cents per railcar-mile can become a material cost during harvest.
Harvest demand leaves less room to absorb the cost
The surcharge spike is landing as grain movement is already heavy. USDA reported that U.S. Class I railroads originated 26,268 grain carloads during the week ending Aug. 29, down 6% from the previous week but 11% above the same week last year and 23% above the three-year average.
Railcar availability is also tightening in some areas. USDA said average September shuttle secondary railcar bids and offers were $742 per car above tariff for the week ending Sept. 3, up $104 from the prior week and $788 above the same week in 2025. In North Dakota, unfilled manifest grain car orders reached 1,147 for the week ending Aug. 28, the first time this year the state’s backlog exceeded 1,000 orders.
That North Dakota backlog coincided with a fast-moving wheat harvest. USDA’s Crop Progress figures cited in the Grain Transportation Report showed North Dakota’s spring wheat harvest at 86% complete as of Sept. 6, above the prior five-year average of 77%.
Farm margins feel the pressure first
The first effect is usually not a grocery shelf price. It shows up in basis, freight invoices and the price offered at local elevators.
Basis is the difference between a local cash grain price and the relevant futures price. When transportation costs rise, grain buyers and elevators can account for those costs in the bids offered to farmers. That can leave producers with a weaker cash price even if the futures screen has not moved by the same amount.
Reuters reported that rail fuel surcharges accounted for 11% of total rail transportation costs for shipping corn and soybeans in the USDA’s Sept. 10 report, compared with 5% one year earlier. Reuters also cited a Kansas wheat and sorghum farmer who said the basis at his local elevator was around 70 cents per bushel below Kansas City hard wheat futures, compared with a more typical level closer to 40 cents under.
The pressure is especially hard for rail-dependent regions that lack nearby barge access. Corn, soybeans and wheat often move long distances to export terminals, processors, livestock operations and ethanol plants. Higher rail charges can therefore touch several markets at once: the farmer’s cash return, the processor’s input cost, the exporter’s landed price and the feed buyer’s delivered cost.
Canada is watching the same cost chain
The current surcharge figures are based on USDA grain transportation data, but the rail cost signal is relevant across North American supply chains. Canadian National and Canadian Pacific Kansas City are included in USDA’s Class I rail sources for the North American weighted-average fuel surcharge measure, and both railways are moving heavy Canadian grain volumes.
CN said it moved 2.50 million metric tonnes of grain from Western Canada in August, surpassing its previous August record of 2.34 million metric tonnes set in 2020. CPKC said it moved 2.54 million metric tonnes of Canadian grain and grain products in August and set a combined U.S.-Canada monthly grain movement record of 4.86 million metric tonnes across its network.
Statistics Canada’s latest railway carloadings release also showed strong commodity movement before the new crop year opened. Canadian railways moved 30.9 million tonnes of freight in June, up 3.2% from a year earlier. Canola carloadings rose 44.1% year over year, while other cereal grains grew 66.3%.
Those Canadian figures do not mean every Canadian grain route carries the same surcharge structure as a U.S. rail move. They do show why fuel-sensitive rail costs matter when grain volumes are high and cross-border agricultural supply chains are active.
A freight surcharge can become a food-input cost
The cost chain is straightforward: energy prices lift diesel indexes, diesel indexes lift fuel surcharges, fuel surcharges lift freight costs, and freight costs change the economics of moving grain. From there, the impact can split across farmers, elevators, processors, livestock feeders, exporters and buyers.
Some of the cost can be absorbed in margins. Some can be passed forward through higher delivered prices. The split depends on crop prices, export demand, contract terms, available transportation alternatives and how quickly fuel prices retreat.
The same cost-pass-through pattern has appeared in other freight stories, including Tech Help Canada’s coverage of how a Panama Canal slot auction can reach import costs. A logistics charge starts as an operational detail, then becomes a pricing issue when volumes are large and alternatives are limited.
Signals to follow next
The immediate number to watch is the EIA’s weekly diesel print. If diesel remains near record levels, fuel surcharge formulas are likely to keep pressure on rail bills. If diesel falls quickly, the timing of surcharge adjustments will matter because shippers often complain that fuel fees rise faster than they fall.
- USDA grain rail data: the weekly Grain Transportation Report will show whether the 48-cent surcharge holds, rises or begins to ease.
- Secondary railcar bids: higher bids above tariff can compound the surcharge burden when rail capacity is tight.
- Basis levels: weaker local cash bids in rail-dependent regions would show how freight costs are landing at the farm gate.
- Railroad fuel surcharge revenue: Reuters reported that Surface Transportation Board data showed railroads collected $2.93 billion in fuel surcharges during the second quarter, more than 90% above the year-earlier period.
Record rail fuel surcharges are not a one-day grocery price story. They are a warning signal in the cost structure behind grain, feed, processing and exports. When fuel prices, harvest demand and rail capacity pressure line up at the same time, the freight bill becomes harder for the food system to ignore.

I can suggest related Tech Help Canada articles based on the topic you’re reading now.

Tech Help Canada Staff researches, writes, and reviews practical content for business owners and professionals. Our coverage spans business, marketing, SEO, technology, and the tools and systems people use to grow and operate online. We focus on clear, useful information backed by research, hands-on experience, and editorial review. Learn more about our team and editorial standards. Need help with something? Contact Us