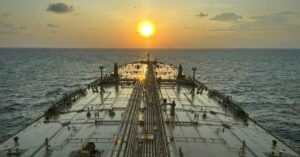
Tanker freight has become one of the clearest signals of stress in energy markets. The latest Baltic Exchange weekly tanker report, published September 25, put the daily round-trip time-charter equivalent for a standard VLCC on the Middle East Gulf-to-China route at $1,235,414, even after the route eased slightly during the week.
VLCC stands for very large crude carrier, the supertanker class used on major long-haul crude routes. Reuters describes these ships as able to carry about 2 million barrels of oil. A time-charter equivalent, or TCE, converts a voyage into estimated daily earnings under standard route assumptions, making it easier to compare freight markets.
The Baltic Exchange’s Week 39 report showed not only one overheated route, but a broader rate surge across crude tanker classes.
Route or segment
Latest Baltic TCE
VLCC, Middle East Gulf to China
$1,235,414 per day
VLCC, Gulf of Oman to China
$864,698 per day
VLCC, West Africa to China
$507,060 per day
Suezmax, Nigeria to UK Continent
about $228,400 per day
Aframax, Cross-UK Continent
close to $306,600 per day
The year-over-year change is extreme
The same Baltic Week 39 report in 2025 said the Middle East Gulf-to-China VLCC route corresponded to around $90,000 per day. This year’s Week 39 figure was more than 13 times higher.
The comparison matters because crude itself is not the only variable. A refiner may still source barrels, but if moving them requires scarcer tonnage, longer voyages, more waiting time, or risk premiums, delivered supply tightens before the commodity price tells the full story.
The bottleneck is effective capacity
Shipping capacity is not just the number of ships on paper. A tanker waiting for ship-to-ship transfer equipment, avoiding a risky passage, ballasting toward a higher-paying basin, or locked into a shuttle route is unavailable for ordinary cargo flow.
Reuters reported September 25 that Gulf of Oman ship-to-ship transfers for Middle Eastern oil from inside the Strait of Hormuz had reached capacity limits after Saudi Arabia diverted exports from the Red Sea, adding to flows from other producers. Kpler data cited in the report showed Saudi crude exports through Hormuz were on track to reach 3.6 million barrels per day in September, compared with about 900,000 barrels per day in August.
Reuters also cited LSEG data showing the daily time-charter rate for a Middle East-to-China VLCC reached a record $1.27 million on Monday, September 21. A separate Reuters dispatch, citing preliminary Kpler data, said crude flows out of Hormuz had reached 33.7 million barrels so far in the week starting September 20, roughly on track with the previous week’s level. The traffic comprised 19 tankers, including 17 VLCCs.
Hormuz makes the transport problem systemic
The Strait of Hormuz is not a niche route. The International Energy Agency’s Hormuz factsheet, last updated in February 2026, said an average of 20 million barrels per day of crude and oil products moved through the strait in 2025, equal to about 25% of world seaborne oil trade. The agency said 80% of that oil was destined for Asia and estimated only 3.5 million to 5.5 million barrels per day of pipeline capacity could redirect crude flows around the strait.
The U.S. Energy Information Administration’s August 2026 energy security data show how large the disruption had already been earlier this year. Total oil flows through Hormuz fell from 21.6 million barrels per day in the fourth quarter of 2025 to 4.9 million barrels per day in the second quarter of 2026. Those data are not the latest weekly flow figures, but they show why tanker availability, routing, and transfer capacity have become central to energy pricing and security.
High freight can travel through the supply chain
Extreme tanker rates do not automatically mean retail fuel prices move in the same direction at the same speed. The link depends on crude prices, refinery margins, inventories, taxes, regional supply, currency moves, and contract terms.
Even so, shipping is a cost layer. When more money is required to secure tonnage, and more time is required to complete a voyage, importers and refiners face a different delivered-cost equation. The Baltic Exchange’s latest figures show that pressure is not limited to one supertanker route. Suezmax and Aframax routes also printed six-figure daily TCEs in the same weekly report.
Lloyd’s List analysis earlier in September pointed to the same mechanism: Hormuz-related workarounds, ship-to-ship transfer patterns, and longer West-to-East voyages consume vessel time. In a tight market, the ship that spends longer on one cargo is effectively removed from someone else’s supply chain.
The market is watching ships, not only barrels
The next signals are likely to come from daily tanker assessments, Gulf of Oman transfer capacity, Hormuz transit counts, and whether diverted Red Sea flows return to their previous routes. A fall in crude benchmarks would not necessarily erase freight pressure if ships remain scarce or transfer queues stay congested.
For now, tanker economics have become a warning light. Energy stress is showing up not only in the commodity itself, but in the physical system required to move it.
Get new small business insights by email
Practical ideas and useful articles to help you make better business decisions.
Tech Help Canada Staff researches, writes, and reviews practical content for business owners and professionals. Our coverage spans business, marketing, SEO, technology, and the tools and systems people use to grow and operate online. We focus on clear, useful information backed by research, hands-on experience, and editorial review. Learn more about our team and editorial standards. Need help with something? Contact Us