If you’re deciding where to open or expand, you’ll want more than a city’s reputation to go on. We compared business openings and closures across 35 Canadian metropolitan areas to help you decide which markets to investigate more closely.
Moncton leads relative to market size
Moncton ranked first for openings minus closures relative to the size of its business market. Halifax, Saskatoon, Thunder Bay and Edmonton followed.
Tech Help Canada analysed Statistics Canada’s seasonally adjusted business-sector estimates for August 2025 through July 2026. The figures cover businesses with employees across 35 metropolitan areas. The totals include reopenings and temporary closures.
To compare markets of different sizes, we show openings minus closures per 1,000 active employer businesses. We use the average monthly number of active businesses in each metro. A positive balance means more openings than closures; a negative balance means more closures than openings.
Moncton recorded 2,027 openings and 1,909 closures, a balance of +118. It averaged about 4,201 active employer businesses, putting its balance at +28.1 per 1,000. Halifax followed at +24.5, Saskatoon at +23.9, Thunder Bay at +23.3 and Edmonton at +19.3.
Business openings and closures across 35 Canadian metros
The table ranks metros by their balance per 1,000 active employer businesses. Opening and closure totals cover August 2025–July 2026. Figures refer to the wider metropolitan area for each city.
Rank
Metro area
Openings
Closures
Balance per 1,000
1
Moncton, NB
2,027
1,909
+28.1
2
Halifax, NS
6,193
5,914
+24.5
3
Saskatoon, SK
4,577
4,378
+23.9
4
Thunder Bay, ON
1,345
1,279
+23.3
5
Edmonton, AB
26,616
25,846
+19.3
6
Lethbridge, AB
1,831
1,770
+17.4
7
Calgary, AB
33,207
32,407
+17.0
8
Abbotsford–Mission, BC
3,999
3,918
+13.9
9
Québec, QC
6,890
6,610
+13.7
10
Kingston, ON
2,102
2,066
+9.1
11
Greater Sudbury, ON
1,710
1,679
+8.9
12
Ottawa–Gatineau, ON/QC
15,935
15,685
+8.2
13
Kelowna, BC
4,191
4,142
+6.6
14
London, ON
6,608
6,534
+6.3
15
Winnipeg, MB
10,507
10,389
+6.1
16
Victoria, BC
5,821
5,762
+5.2
17
Sherbrooke, QC
2,053
2,030
+4.1
18
Regina, SK
3,273
3,252
+3.4
19
St. Catharines–Niagara, ON
5,313
5,283
+3.4
20
Saint John, NB
1,489
1,484
+1.7
21
Oshawa, ON
5,017
5,013
+0.5
22
Windsor, ON
5,117
5,116
+0.1
23
Saguenay, QC
1,131
1,136
−1.4
24
Kitchener–Cambridge–Waterloo, ON
8,081
8,129
−3.6
25
Barrie, ON
3,129
3,150
−4.1
26
Montréal, QC
49,243
49,761
−4.9
27
Peterborough, ON
1,426
1,441
−5.0
28
Trois-Rivières, QC
1,148
1,170
−5.9
29
Hamilton, ON
10,758
10,866
−5.9
30
Vancouver, BC
55,251
55,779
−5.9
31
St. John’s, NL
2,938
3,018
−13.6
32
Toronto, ON
126,657
129,309
−14.1
33
Guelph, ON
2,179
2,242
−15.3
34
Belleville, ON
1,125
1,181
−24.4
35
Brantford, ON
1,973
2,074
−30.3
Analysis by Tech Help Canada using Statistics Canada estimates. Balances are displayed to one decimal; ordering uses the unrounded figures.
Openings exceeded closures in 22 of the 35 metros. In some markets, the two were closely matched. Windsor recorded 5,117 openings and 5,116 closures, while Oshawa recorded 5,017 and 5,013.
Toronto had the largest volume of openings among the metros studied, at 126,657. Its 129,309 closures left a balance of −2,652, or −14.1 per 1,000.
Calgary has the largest total balance
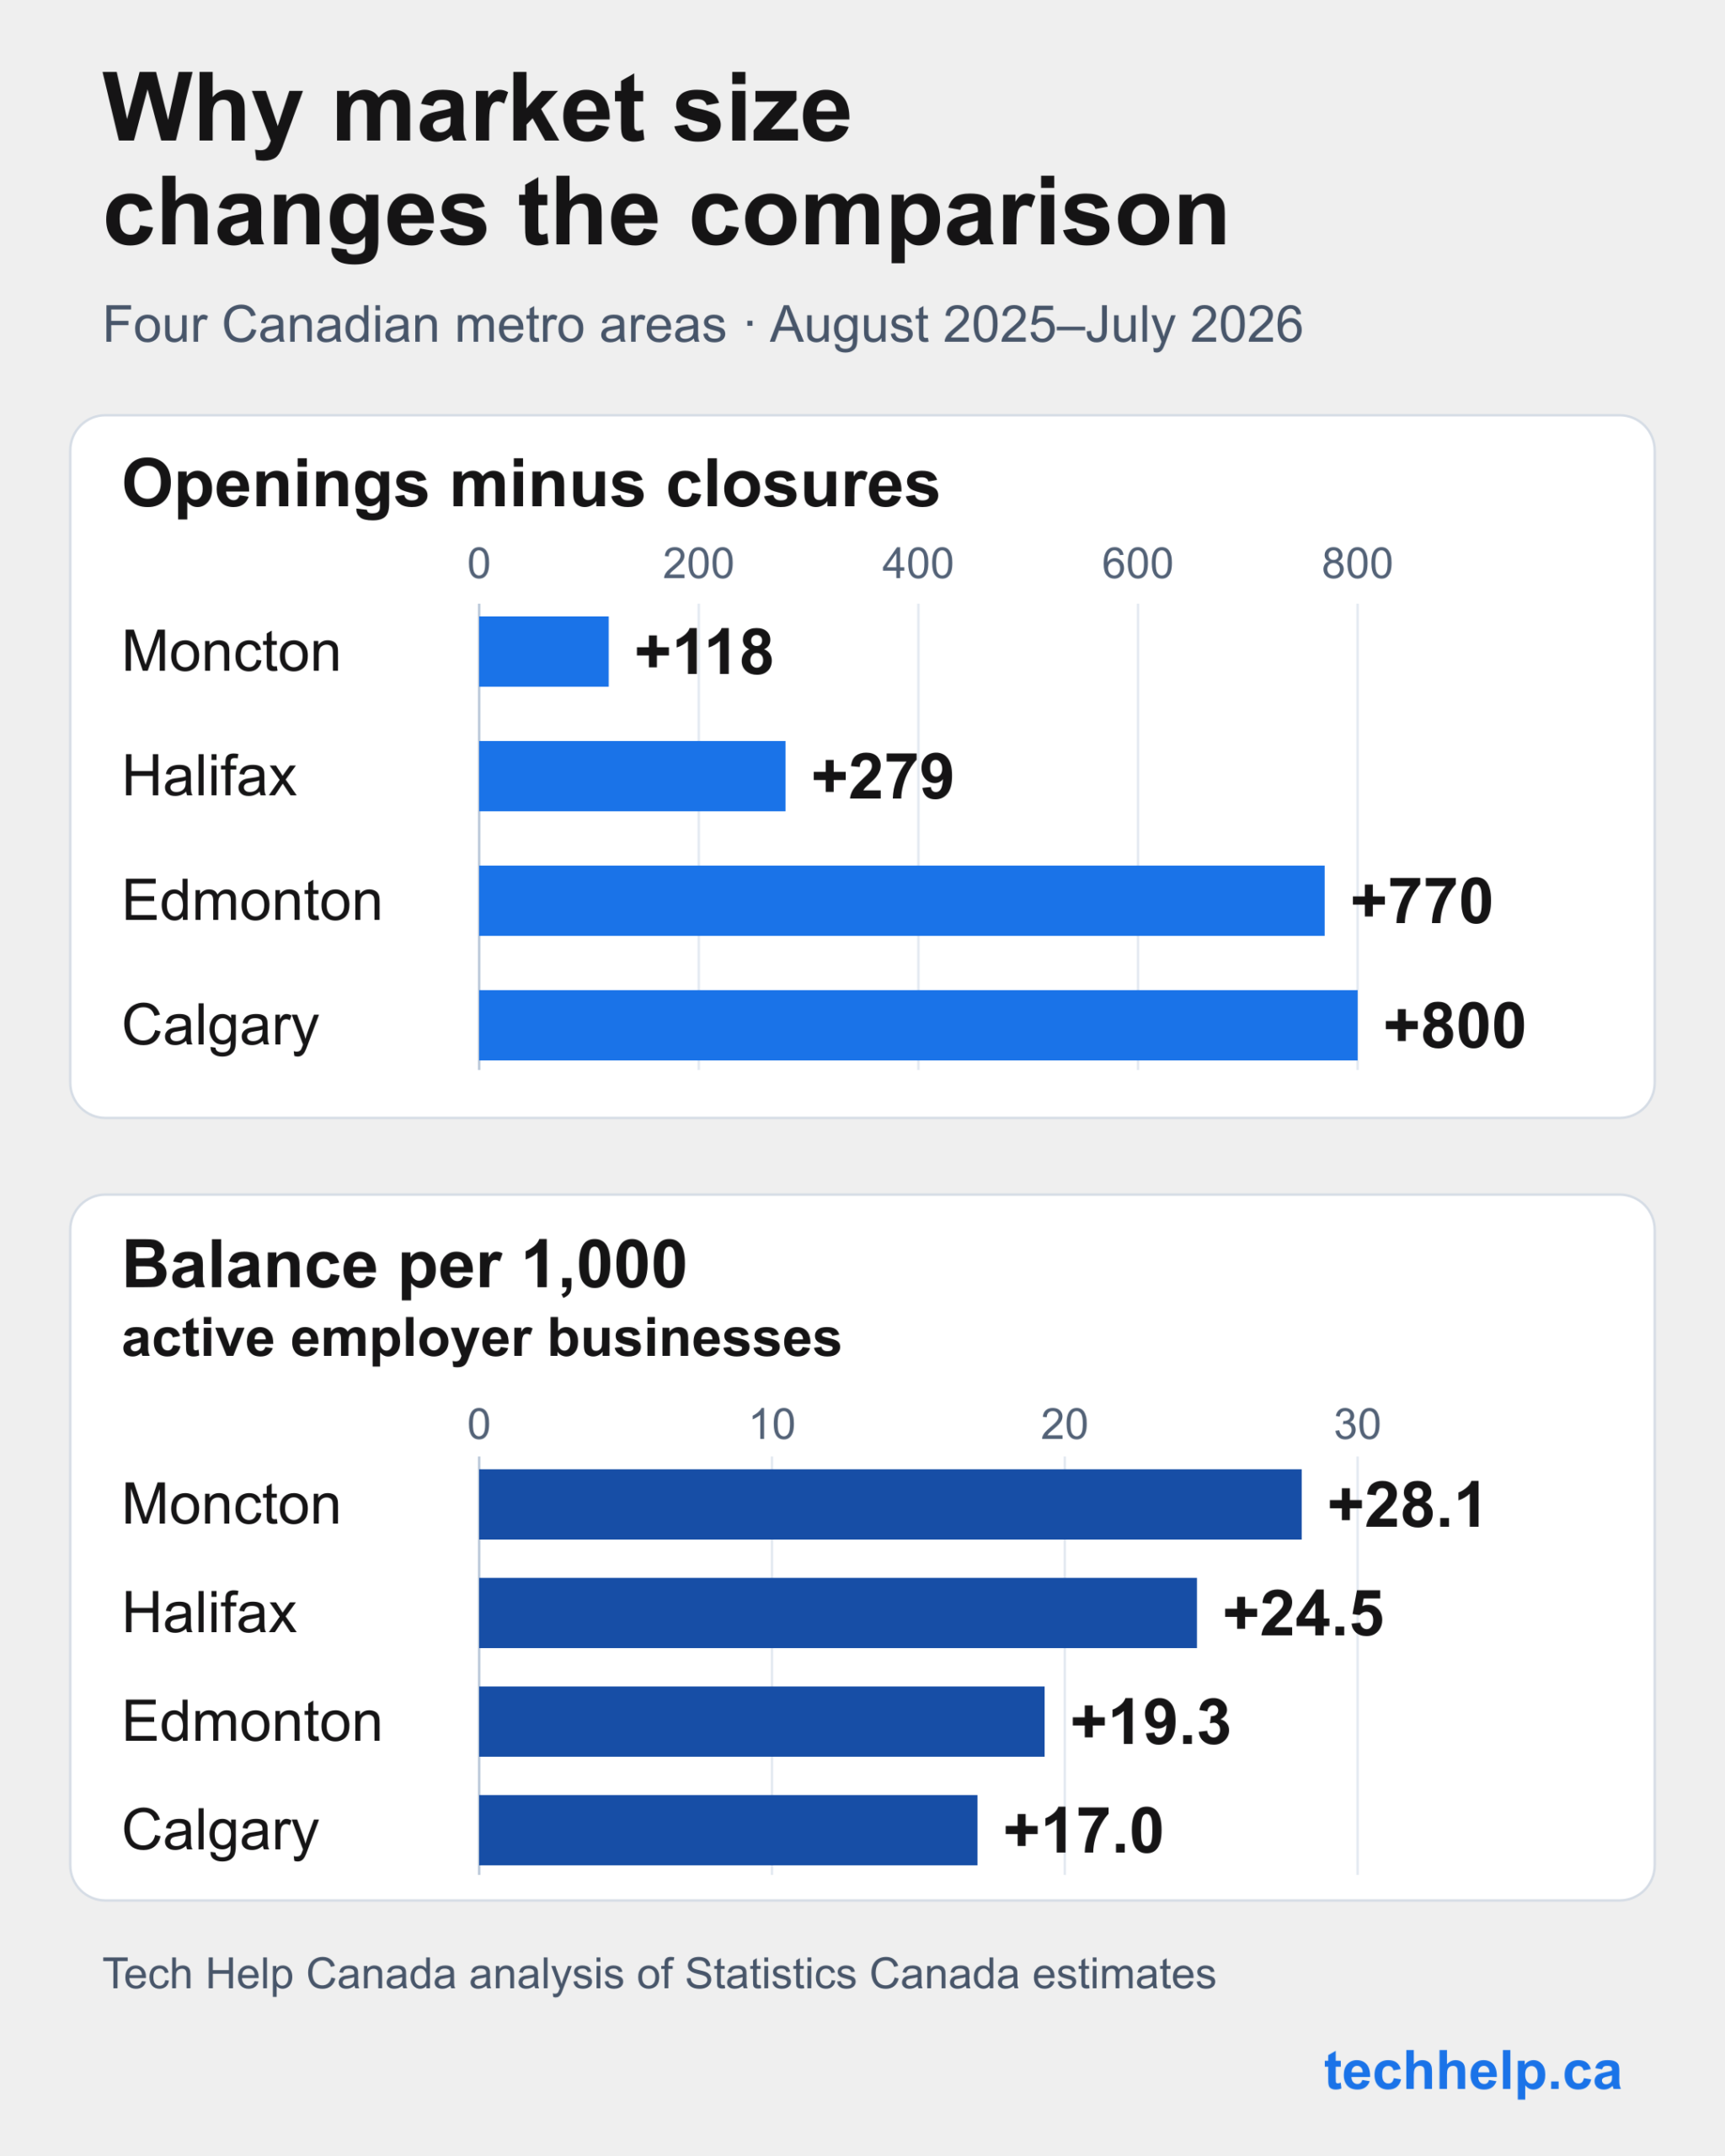
Calgary recorded 800 more openings than closures, the largest total balance in the comparison. Edmonton followed with +770. Moncton’s +118 was smaller as a total, but it ranked first after adjusting for market size.
Calgary averaged about 47,010 active employer businesses during the period, compared with Moncton’s 4,201. That puts Calgary’s balance at +17.0 per 1,000 and Moncton’s at +28.1.
Calgary has the larger total balance; Moncton’s balance is larger relative to its employer-business base. The two views help distinguish market scale from relative activity.
If you sell to other businesses, the number of active employers helps you gauge the scale of a potential market. The balance per 1,000 lets you compare opening and closing activity across locations of different sizes.
Halifax stays near the top across different periods
Halifax placed second in the main 12-month comparison. It also placed first or second in each of the 12-month periods ending in April, May and June 2026.
We also compared six-month and 24-month periods and the ratio of openings to closures. Halifax stayed in the top three across all seven comparisons, while Moncton stayed in the top five.
That consistency gives you a reason to investigate demand for your business in Halifax and Moncton.
Thunder Bay shows the largest year-over-year improvement
Thunder Bay’s balance moved from −10.3 to +23.3 per 1,000 active employer businesses. That increase of 33.6 per 1,000 was the largest among the 35 metros.
Greater Sudbury, Abbotsford–Mission, Kingston and Ottawa–Gatineau had the next four largest improvements. All five metros moved from a negative balance to a positive one between the two 12-month periods.
The table shows balances and changes per 1,000 active employer businesses.
Metro area
Aug 2024–Jul 2025
Aug 2025–Jul 2026
Change
Thunder Bay, ON
−10.3
+23.3
+33.6
Greater Sudbury, ON
−14.9
+8.9
+23.9
Abbotsford–Mission, BC
−7.8
+13.9
+21.7
Kingston, ON
−12.0
+9.1
+21.2
Ottawa–Gatineau, ON/QC
−11.1
+8.2
+19.3
Changes are calculated before rounding the displayed figures.
Thunder Bay also ranked first or second for improvement in each of the four 12-month comparisons ending from April through July 2026.
If you last researched one of these markets a year ago, the recent improvement gives you a reason to revisit local demand.
Guelph leads over the latest six months
Guelph ranked 33rd over August 2025–July 2026. It placed first when we narrowed the comparison to February–July 2026.
The latest six months show a stronger relative balance even though the full-year balance remains negative.
If Guelph is on your shortlist, find out which types of businesses account for the recent activity. Ask local business organizations and prospective customers what they’re seeing in the industries you want to serve.
Turn the comparison into a market shortlist
Start with the places your business can realistically serve. An owner opening a second location may need to stay within travelling distance of the first. A specialist service business may have more freedom to choose a market where the right customers are concentrated.
For each location, note its opening and closure totals and its balance per 1,000. Then identify the types of customers you’d want to serve there.
Find the customers you could serve
Suppose you’re deciding where to offer bookkeeping services. Use the comparison to select a market to investigate, then find businesses in the sectors you understand. Ask how they handle bookkeeping, what causes problems and what would make them change providers.
For a store or service tied to a neighbourhood, narrow the research to the area customers will actually travel from.
Compare the offer you could make in each market
Review competing businesses, their prices and the needs customers say are going unmet. Then compare the costs of serving those customers, including premises, staffing, travel or delivery where relevant.
Use what you learn about customers, competitors and costs to decide where to test your offer.
Choose two or three metro areas from the comparison and write down the customer group you’d target in each. For each location, book a customer interview, get a local cost estimate or run a small test of demand.
Frequently asked questions
Does Ottawa–Gatineau include both Ontario and Quebec?
Yes. The Ottawa–Gatineau row covers the complete metropolitan area across both provinces. Use it when comparing that regional business market with the other metros in the table.
How can an online business use this local-market comparison?
Use it when your offer targets businesses or customers in specific places. The figures can help you select regions for customer research, then assess demand for your offer within those regions.
Where should I start if my business will serve one neighbourhood?
Study the customers, competitors and trading conditions in that neighbourhood. Use the metro result as regional context, then investigate the area your customers will actually travel from and how they currently buy the service or product you plan to offer.
Get new small business insights by email
Practical ideas and useful articles to help you make better business decisions.
Tech Help Canada Staff researches, writes, and reviews practical content for business owners and professionals. Our coverage spans business, marketing, SEO, technology, and the tools and systems people use to grow and operate online. We focus on clear, useful information backed by research, hands-on experience, and editorial review. Learn more about our team and editorial standards. Need help with something? Contact Us