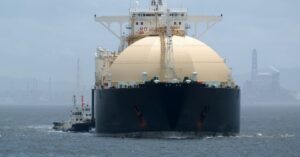
LNG freight rates are weakening again, even as gas buyers prepare for winter. Spark Commodities said on Oct. 8 that its Spark30S Atlantic spot assessment for a modern 174,000-cubic-metre two-stroke LNG carrier had fallen to $21,250 per day.
Spark Commodities said Atlantic spot rates reached a 2026 low of $9,000 per day on Aug. 24, recovered through September to a month-high of $36,250 per day on Sept. 28, then retraced by $15,000. Spark also said September 2026 closed as the lowest assessed September on record for a modern 174,000-cbm two-stroke vessel in the Atlantic, and that October was tracking toward the lowest assessed October on record at current levels.
Other route benchmarks are not identical, but they show the same pressure on Atlantic freight. The Baltic Exchange’s Oct. 2 Week 40 gas report said the BLNG2 US Gulf–Continent route fell $8,000 during the week to close at $28,600 per day. The BLNG3 US Gulf–Japan route declined $6,300 to $59,100 per day, while the BLNG1 Australia–Japan route rose $1,300 to $37,700 per day as the Pacific market proved more resilient.
Pacific freight has held up better because demand and vessel lists are tighter there. Atlantic rates have been more exposed to prompt vessel availability and shorter voyages into Europe.
The March disruption premium has faded
The current market looks even weaker when compared with the disruption-driven highs seen earlier in 2026. PortNews, citing Spark Commodities, reported on Oct. 7 that Spark30S stood at $25,750 per day on Oct. 6, down from $287,500 per day in early March. The comparable Pacific assessment was $39,000 per day, compared with $225,750 per day in early March.
Using those figures, the Atlantic assessment had lost about 91% of its early-March level, while the Pacific assessment had fallen by about 83%. That comparison should be read as a measure of how far the temporary disruption premium has unwound, not as a sign that LNG trade has stopped functioning.
Newbuild deliveries are putting owners under pressure
The vessel side of the market is heavy. In an Aug. 19 filing with the US Securities and Exchange Commission, Flex LNG said the LNG carrier newbuild orderbook stood at about 285 vessels, equal to roughly 37% of the fleet on the water. The company said around 55 vessels had been delivered during the first seven months of 2026, with another 40 to 45 expected before year-end, followed by roughly 95 vessels in 2027 and 80 in 2028.
Drewry had warned earlier in the year that a strong rate rebound would be difficult because more than 100 LNG carriers were scheduled for delivery in 2026 after 76 deliveries in 2025. Drewry also expected 18 to 20 LNG carriers to be scrapped in 2026, but said those removals would still not be enough to balance the vessel surplus.
The International Energy Agency made a similar point in its first-quarter 2026 gas market report, saying the global LNG carrier fleet was expected to remain oversupplied during 2026. The agency said freight charter rates were likely to stay below long-term averages as vessel capacity continued to outpace growth in seaborne LNG trade.
US cargoes are strong, but the route mix matters
US LNG exports are not weak. The US Energy Information Administration said LNG exports averaged 17.4 billion cubic feet per day in the first half of 2026, 23% higher than the same period in 2025. It also estimated exports would average 17.3 Bcf/d in the second half of 2026 before rising again in early 2027.
But where those cargoes go matters for shipping demand. S&P Global Energy reported that Europe plus Turkey received 76 of the 143 US LNG cargoes delivered in September, about 53% of the total. The same report said Europe plus Turkey accounted for 85 of the 156 US cargoes loaded during the month, about 54%.
A voyage from the US Gulf Coast to Northwest Europe keeps a ship occupied for less time than a voyage from the US Gulf Coast to North Asia. When Europe absorbs a larger share of flexible US cargoes, vessels can return to the Atlantic market sooner, increasing prompt ship availability and reducing tonne-mile demand.
European storage levels also explain why cargo demand and freight weakness can coexist. Gas Infrastructure Europe showed EU storage at 72.97% full on Oct. 7, with Germany at 59.3% and the Netherlands at 60.97%. Europe still needs gas, but stronger European pull does not automatically tighten shipping if cargoes are moving over shorter routes.
High LNG prices do not guarantee high freight
The market is separating LNG cargo pricing from LNG carrier employment. Gas prices can remain elevated because of winter demand, supply disruption, or storage concerns, while freight rates weaken if there are enough available vessels and cargoes are not creating longer sailing distances.
The Baltic Exchange’s Week 40 report captured that split. It said improving sentiment from the previous week failed to turn into a sustained recovery in spot earnings. The six-month time-charter assessment rose to $47,900 per day, but the one-year and three-year assessments declined to $52,367 and $70,300 per day, respectively.
That mixed period market suggests charterers still see some near-term risk, but they are not pricing a broad, sustained squeeze across the LNG carrier fleet.
Spot exposure is where the pressure lands first
The rate decline does not hit every LNG shipowner the same way. Vessels fixed on long-term charters can be insulated from day-to-day spot weakness. Ships coming open into spot or short-term employment face the market more directly.
Flex LNG’s own disclosure shows why contract cover matters. The company reported about 89% firm contract coverage for the remainder of 2026 in August, even as it described a volatile freight market affected by fleet growth and competition between Europe and Asia for LNG volumes.
Older and less efficient ships may face more pressure if weak spot rates persist. Drewry has already pointed to more scrapping and a larger idle fleet as modern newbuildings continue entering service.
Winter can still bring volatility
The current weakness should not be read as a fixed path for the rest of the season. LNG freight can move quickly if Asian demand strengthens, the Europe–Asia price spread changes, weather lifts spot buying, or disruption forces longer routes and vessel delays.
The IEA’s first-quarter report framed the market as a tension between structural oversupply and intermittent operational constraints. The ship supply overhang is real, but shocks can still produce short bursts of tighter effective availability.
Until more liquefaction capacity and sustained long-distance trade absorb the delivery wave, LNG freight rallies may remain vulnerable to the next build-up of available vessels.
Get new small business insights by email
Practical ideas and useful articles to help you make better business decisions.
Tech Help Canada Staff researches, writes, and reviews practical content for business owners and professionals. Our coverage spans business, marketing, SEO, technology, and the tools and systems people use to grow and operate online. We focus on clear, useful information backed by research, hands-on experience, and editorial review. Learn more about our team and editorial standards. Need help with something? Contact Us