Startups depend on measurable actions, and the AARRR Framework helps teams focus on user behaviors that support sustainable growth. It’s widely used by startups, SaaS companies, and product teams to help structure the user journey around the metrics that matter most.
In this guide, you’ll learn what the AARRR Framework is, how each stage works, and how to apply it strategically across your customer funnel.
The AARRR Framework, also known as Pirate Metrics, is a five-stage model designed to track and optimize key user behaviors that drive growth. Created by startup investor Dave McClure in 2007, it helps early-stage teams focus on the metrics that truly reflect product performance.
Instead of relying on vanity numbers, AARRR encourages companies to evaluate how users move through their funnel and where value is actually being created. It remains a go-to tool in growth marketing, product strategy, and investor conversations.
The framework is made up of five essential stages, each tied to a specific phase in the user journey:
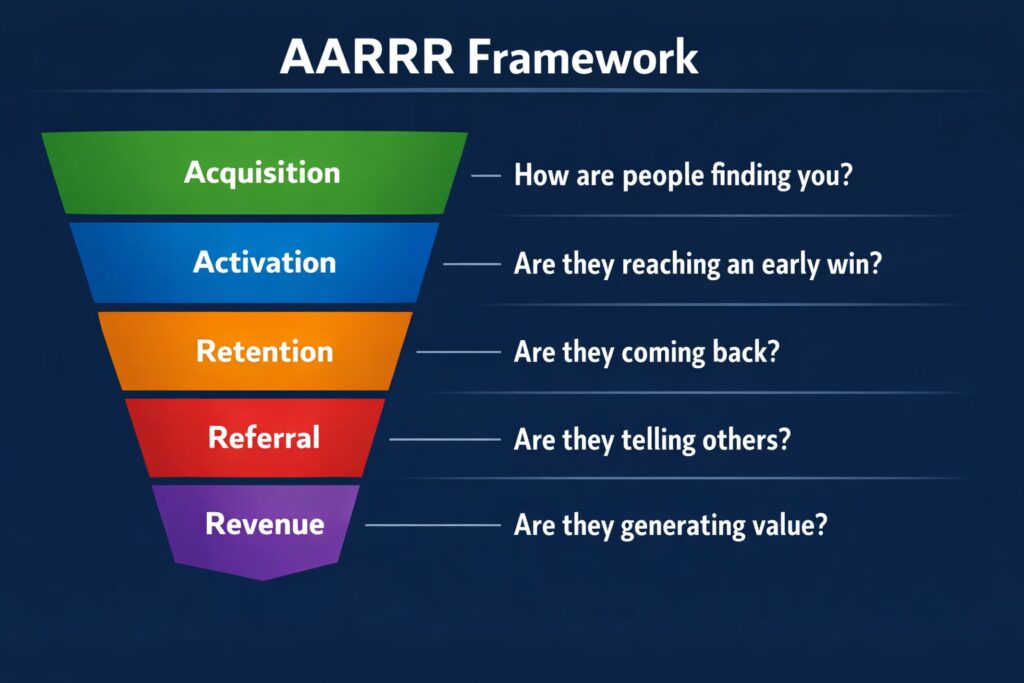
Acquisition – How users find you (ads, SEO, social, referrals, etc.).
Activation – When users have a first successful experience with your product.
Retention – How often and how long users keep coming back.
Referral – When users share your product or service with others.
Revenue – How and when users start generating value through payment or monetization.
Each stage helps diagnose performance gaps, understand user behavior, and optimize accordingly. When implemented well, AARRR becomes the backbone of growth strategy—not just a reporting framework.
AARRR Metrics Explained with Illustrative Examples
Each stage of the AARRR Framework tracks a core moment in the user journey that drives sustainable growth. Below, you’ll find a deeper look at each metric—what it means, why it matters, and how teams often think about it in practice.
Acquisition
Acquisition is the process of getting new users or visitors to discover and engage with your product or service for the first time. It includes all top-of-funnel channels like SEO, paid ads, social media, PR, or partnerships. The goal is not just reach, but attracting the right users who are likely to activate. Strong acquisition strategies are often measured by traffic sources, click-through rates, or cost per lead.
Examples:
Referral-driven signups can be a powerful acquisition channel, as Dropbox showed in its early growth.
A design platform can build momentum through SEO and content marketing aimed at people searching for templates, presentations, and design tools.
Activation
Activation measures when users have a meaningful first experience that shows the product’s value. It could be completing onboarding, creating their first project, or reaching a key feature milestone. The focus is to help users experience the “aha” moment quickly and smoothly. This is a major indicator of future retention and product fit.
Examples:
For a workspace tool like Notion, activation might be defined as a user creating content and interacting with the editor early on.
For a team collaboration product like Slack, activation is often tied to an early action that shows real collaboration has started, such as sending a first message.
Retention
Retention tracks how often users come back and continue using the product after their first session. High retention means users are seeing repeat value and forming a habit with your tool or service. It’s a strong signal of product-market fit and long-term growth potential. Poor retention usually points to friction, missing value, or broken onboarding.
Examples:
Spotify supports retention with personalized playlists like Discover Weekly, giving users a reason to return regularly.
Duolingo uses gamified streaks and push notifications to maintain daily language practice and increase session frequency.
Referral
Referral captures how often users share your product with others, bringing in new users organically. This metric reflects user satisfaction and strong product advocacy. Referral loops help reduce customer acquisition costs and can drive exponential growth if designed well. Measuring this often includes invite rates, referral codes used, or viral coefficient.
Examples:
Airbnb offered travel credits for users who referred friends, turning guests into promoters.
Tesla used a referral program that rewarded owners with exclusive perks for every new buyer they brought in.
Revenue
Revenue tracks how and when users convert into paying customers or otherwise generate value. This could include subscriptions, one-time purchases, upgrades, or ad views. Understanding which actions lead to revenue helps optimize pricing, product tiers, and upsell opportunities. It also highlights the lifetime value of your users and overall profitability.
Examples:
Zoom monetizes its free tier in part through meeting time limits, which can create a natural upgrade point for heavier users.
Shopify generates revenue through subscriptions and selling-related fees tied to store activity and payments.
How Teams Often Apply the AARRR Framework in Practice
The AARRR framework tends to be most useful when teams connect it to real user journeys, not just spreadsheets. In practice, that usually means tying product, data, and decision-making together in a way that reflects how users actually move through the funnel.
1. Map Your Customer Journey to AARRR Stages
One starting point is identifying where each stage—Acquisition, Activation, Retention, Referral, Revenue—fits into your specific customer experience.
Don’t assume users move linearly; look at real usage patterns and drop-off points. Mapping the journey visually helps teams align on which touchpoints matter most at each step.
This clarity lets you place product features and marketing tactics into the right growth context. For example, a homepage visit is acquisition, while completing onboarding is activation.
Proper mapping gives your team a shared language for analyzing performance and optimizing user flow.
Pro Tip: Use a whiteboard or digital mapping tool like Miro or Whimsical to visualize user flow across each stage. This gives stakeholders a shared view and makes hidden drop-off points easier to spot.
2. Define Key Metrics for Each Stage
Once your journey is mapped, define exactly how you’ll measure success at each AARRR stage. Pick one or two core metrics per phase that reflect clear user actions rather than vanity metrics.
For Acquisition, this might be “new users from organic search,” while for Activation it could be “percentage of users who complete onboarding.”
Metrics should be consistent, measurable, and tied directly to user behavior—not feelings or assumptions. The goal is to create a clean funnel with signals that reflect true engagement and value. Fewer, better metrics lead to sharper decision-making and faster iteration.
Pro Tip: Choose metrics that represent user actions, not pageviews or impressions. Always tie each KPI to a specific business question or decision.
3. Use Tools to Capture and Track Data
Teams need visibility to improve performance, so it helps to set up tools that track AARRR metrics across platforms and channels.
Use Mixpanel, Amplitude, or PostHog to capture event-based data, or integrate Google Analytics for acquisition and conversion insights. For early-stage teams, even a clean spreadsheet can work if it’s updated regularly and tied to actions.
Make sure your tracking setup reflects your AARRR map and isn’t cluttered with irrelevant noise. Define each event clearly and ensure every tool is aligned with your KPIs. Without clean data, even the best framework becomes guesswork.
Pro Tip: Start with a lightweight analytics stack—Mixpanel or PostHog for events, and Google Analytics for traffic. Avoid overtracking; focus only on metrics tied to your AARRR map.
4. Segment Users Based on Behavior
Not all users behave the same—and that matters at every AARRR stage. Behavioral segmentation helps you group users based on factors like signup source, feature usage, session frequency, or churn risk.
This allows you to identify which users are progressing through the funnel and which ones need intervention.
For example, you might segment users who activated but never returned, or those who referred others without converting to paid plans.
These segments unlock smarter messaging, personalized onboarding, and targeted retention tactics. The more precise your segmentation, the more relevant your growth efforts become.
Pro Tip: Behavioral triggers can make follow-ups more relevant—for example, onboarding nudges sent only to users who have not yet activated.
5. Run Experiments Focused on One Stage at a Time
Trying to fix every metric at once leads to scattered results. Instead, isolate one AARRR stage—like Activation—and run experiments designed to move that specific metric. This gives you cleaner data, faster learning cycles, and better attribution of what worked.
For instance, test two onboarding flows and track which one drives higher activation rates within the first 48 hours. Let it run, learn, and then move on to the next stage. Stacking small wins across the funnel builds a compound growth effect.
Pro Tip: Keep experiments small, time-boxed, and tied to a single hypothesis. Don’t mix changes across funnel stages or you’ll struggle to attribute what moved the needle.
6. Evaluate and Prioritize Bottlenecks
Every funnel has friction, so the goal is to identify where users drop off and why. Use funnel analysis to measure conversion rates between stages and flag underperforming segments. Don’t guess what’s broken; let the data tell you where attention is needed.
If Activation is strong but Retention drops fast, look at post-onboarding value delivery or time-to-habit. Fixing bottlenecks isn’t about patching symptoms—it’s about addressing the root cause. Prioritize by impact, not ease.
Pro Tip: Use funnel visualization tools like Heap or Amplitude to identify the steepest drop-offs. Prioritize fixes by user impact and potential revenue gain, not just ease of implementation.
7. Align Teams Around Shared Growth Metrics
For AARRR to work, every team—product, marketing, support—needs to rally around the same funnel stages and success indicators. Misalignment leads to competing priorities and fragmented growth efforts. Shared metrics create accountability, focus, and better collaboration.
For example, if Activation is a team priority, marketing should drive qualified traffic while product improves onboarding flow. Everyone works toward the same outcome, just from different angles. When teams own metrics collectively, growth becomes a system, not a silo.
Pro Tip: Set up a shared dashboard with one key metric per AARRR stage visible to all teams. Schedule a monthly review to assess progress and recalibrate priorities as needed.
8. Optimize Across the Funnel, Not Just the Top
It’s tempting to pour resources into Acquisition, but true growth comes from improving performance across all five stages. Many products stall not because they can’t attract users, but because they can’t retain or monetize them. The funnel is only as strong as its weakest link.
A small win in Retention or Referral often drives more sustainable growth than a spike in traffic. The AARRR Framework helps reveal where long-term value is leaking out. The goal is not just to fill the funnel, but to improve it.
Pro Tip: Retention and referral gains often compound over time. In some cases, shifting part of an acquisition budget toward downstream stages can produce a stronger return.
Who Should and Shouldn’t Use the AARRR Framework
The AARRR Framework works best when aligned with digital, product-driven environments, but it’s not a one-size-fits-all tool. The following breakdown shows who benefits most and where alternative approaches may be more effective.
Who Should Use the AARRR Framework
This framework is ideal for teams with digital products, trackable user behavior, and iterative growth strategies. It helps align cross-functional roles around measurable, stage-specific performance indicators.
Startup Founders – Founders use AARRR to understand traction across acquisition, activation, retention, and monetization. It helps them identify bottlenecks and focus on what matters most with limited resources.
Product Managers – PMs apply AARRR to map user behavior and improve product flows. It allows them to connect features with measurable outcomes like retention and referral.
Growth Marketers – Growth teams rely on AARRR to test and optimize campaigns based on funnel stages. It’s a practical framework for tracking the impact of acquisition and conversion strategies.
Customer Success Managers – CSMs focus on retention and referral to reduce churn and improve lifetime value. AARRR provides clear signals for proactive engagement and satisfaction tracking.
Early-Stage Investors and Advisors – Investors use AARRR metrics to assess product-market fit, user growth, and revenue potential. It offers a structured way to analyze traction without needing vanity metrics.
UX and Onboarding Designers – Designers use AARRR to focus on activation and early engagement flows. It helps them identify friction points that hurt long-term retention.
Who Should Not Use the AARRR Framework (or Use It Selectively)
Not every business model maps cleanly to the AARRR stages. In non-digital, relationship-based, or long-cycle environments, the framework may oversimplify or misrepresent growth signals.
Enterprise B2B Sales Teams – In long sales-cycle environments driven by relationships and contracts, AARRR misses key deal stages. ABM or Sales Velocity models are often better aligned.
Traditional Brick-and-Mortar Businesses – Without a digital funnel, it’s difficult to map and track AARRR stages meaningfully. Metrics like foot traffic, average order value, and repeat visit rate are more practical.
Hardware-First Startups – Physical products with long delivery timelines and offline activation need heavy adaptation of AARRR. Product usage data often comes much later in the journey.
Professional Services Firms – Consulting, legal, or accounting firms rely more on referrals, reputation, and relationship-building. Their growth metrics are better modeled through client acquisition cost, retention, and NPS.
Nonprofit or Donor-Driven Organizations – AARRR assumes user monetization and product use, which doesn’t always map to donor behavior or impact goals. Alternative frameworks like Logic Models or Theory of Change may be more appropriate.
AARRR Helps Teams Focus on What Matters
The AARRR Framework gives product teams, marketers, and founders a clear structure for turning user behavior into measurable progress.
Instead of chasing scattered metrics, it helps focus on what actually drives sustainable growth. When applied correctly, it aligns teams, clarifies priorities, and accelerates decision-making.
Still, it’s not a perfect fit for every business model. Companies rooted in sales-heavy, offline, or donor-driven systems will need to adapt—or choose a different lens entirely. Use AARRR where it fits, but always make room for context, experimentation, and common sense.
Frequently Asked Questions
How is the AARRR Framework different from traditional marketing funnels?
The AARRR Framework is product-led and behavior-focused, tracking specific user actions across digital journeys. Traditional marketing funnels often stop at acquisition or conversion, while AARRR goes further by emphasizing retention, referrals, and revenue for long-term growth.
Can the AARRR Framework be used with non-software businesses?
While designed for digital products, AARRR can be adapted for any business with trackable user interactions. However, companies without online workflows or consistent behavioral data may find more success using alternative models tailored to their sales or service structures.
Does the AARRR Framework help with team alignment?
Yes, the AARRR Framework gives cross-functional teams a shared view of customer behavior. When everyone works from the same funnel stages and metrics, product, marketing, and support teams can collaborate more effectively and prioritize actions based on real data, not assumptions.
Affiliate disclosure: Some links in this post are affiliate links. See full disclosure in the page footer.
Not sure what to read next?
I can suggest related Tech Help Canada articles based on the topic you’re reading now.
We empower people to succeed through practical business information and essential services. If you’re looking for help with SEO, copywriting, or getting your online presence set up properly, you’re in the right place. If this piece helped, feel free to share it with someone who’d get value from it. Do you need help with something? Contact Us
Want a heads-up once a week whenever a new article drops?


