A slow website doesn’t always look broken. It just makes people wait long enough to doubt the click, abandon the cart, skip the form, or choose another result.
That’s why a website performance testing checklist should do more than chase one PageSpeed score. You need to know which pages carry business value, which metrics show user pain, and which fixes actually match the bottleneck.
Portent’s site-speed research found that B2B pages loading in one second converted about three times higher than pages loading in five seconds. For ecommerce pages, one-second loads converted about 2.5 times higher than five-second loads. Your results will depend on your offer, traffic source, device mix, and funnel, but the pattern is hard to ignore: speed becomes a business issue when the page supports a lead, sale, booking, signup, or support task.
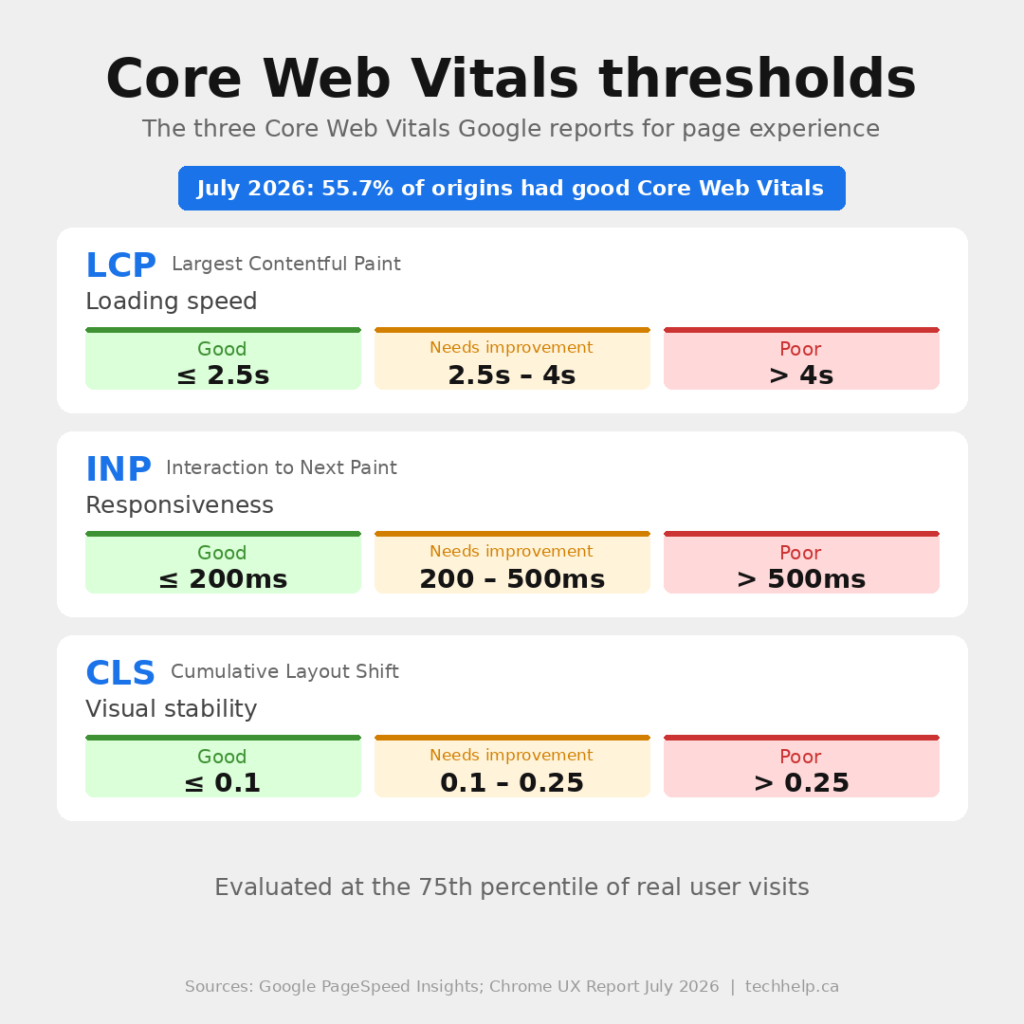
The web still has plenty of room to improve. Chrome UX Report’s July 2026 release reported that 55.7% of origins had good Core Web Vitals across Largest Contentful Paint, Interaction to Next Paint, and Cumulative Layout Shift. That means many sites still have performance issues real visitors can feel.
Use this checklist before a redesign, after a major theme or plugin change, before a sale or campaign, during monthly maintenance, or anytime your site feels slower than it should.
If you want a fast first pass before doing the manual work, Tech Help Canada’s free Website Health Report checks more than 75 site-health signals across performance, security, SEO, accessibility, and related areas.
What is website performance testing?
Website performance testing is the process of measuring how fast, stable, responsive, and usable your website feels for real visitors. It covers loading speed, server response, Core Web Vitals, mobile behavior, page weight, scripts, caching, forms, and key user flows.
Performance testing is different from performance optimization. Testing finds the problems. Optimization fixes them.
A useful test answers four questions:
Question
What it helps you decide
Which pages are slow?
Where to focus first
Which metric is failing?
Whether the problem is loading, interactivity, layout stability, server response, or mobile friction
What is causing the failure?
Whether the fix belongs in hosting, media, CSS, JavaScript, third-party scripts, caching, or layout
Did the fix work for real visitors?
Whether the improvement shows up in field data, not only in a lab score
That last point matters. A lab test can help you debug a page under controlled conditions. Field data shows how real visitors experienced the page across their actual devices, browsers, networks, and locations. You need both.
Start with the pages that carry business value
Don’t test only the homepage unless the homepage is where most decisions happen. The pages that deserve priority are the ones where slow performance can cost you money, leads, trust, or search visibility.
Start with these:
Page type
Why it belongs in the test
Homepage
Often the first branded impression and a common entry point
Top organic landing pages
These pages already earn search traffic, so performance issues can affect existing visibility and engagement
Product, service, or pricing pages
Visitors are closer to a decision
Cart, checkout, booking, or lead forms
Performance problems here can directly reduce conversions
High-traffic articles or resources
Slow pages can waste traffic you already earned
Paid campaign landing pages
Every lost visitor can raise acquisition cost
Mobile-heavy pages
Desktop results may hide the experience most visitors actually get
For each page, record the URL, device type, traffic source, main conversion action, and current performance status. If everything looks urgent, start with the pages closest to revenue or lead generation.
Set the scorecard before you test
Performance testing gets messy when every tool gives you a different number. Before you start changing things, decide which signals you will use and what each one means.
Google’s current Core Web Vitals focus on loading, interactivity, and visual stability. PageSpeed Insights evaluates field data from the Chrome User Experience Report when enough real-user data is available, and it also provides Lighthouse lab data for debugging. The field and lab numbers can differ, especially when your real users are on slower devices or networks than the test environment.
Use this scorecard as your working baseline:
Signal
Good target
What it tells you
Largest Contentful Paint
2.5 seconds or less
The main visible content loads fast enough
Interaction to Next Paint
200 milliseconds or less
The page responds quickly to taps, clicks, and typing
Cumulative Layout Shift
0.1 or less
The page doesn’t jump around while loading
Time to First Byte
0.8 seconds or less as a rough guide
The server and delivery chain are not delaying the first response
Lighthouse performance score
90 or above is good
Lab debugging looks healthy under the test conditions
Page weight
No universal target
The page is not carrying unnecessary images, scripts, fonts, or embeds
Request count
No universal target
The browser is not making avoidable network requests
Mobile usability
No horizontal scroll, readable text, tappable controls
The page works for real handheld use
Conversion flow
Key action works without delay or breakage
Speed issues are not blocking business outcomes
Core Web Vitals are assessed at the 75th percentile. In practice, that means your goal is not to make one test run look good on a fast connection. You want most visitors to get a good experience most of the time.
Also keep the SEO relationship in proportion. Google says its core ranking systems reward helpful content with a good page experience, but Core Web Vitals are not a magic ranking switch. Better content can still outrank a faster but less useful page. Performance matters most when it helps visitors use the page and removes friction from an otherwise useful result.
The website performance testing checklist
Use the checklist below as a working audit. Mark each item Pass, Fix, or N/A. For every Fix item, record the likely owner, tool used, date tested, and retest date.
1. Measurement setup
Before you diagnose anything, make sure you are testing the right page in the right way.
Check
How to test it
Pass condition
Test the final live URL
Open the URL in an incognito window and confirm the browser lands on the final canonical version
No extra redirect chain, wrong protocol, tracking-only URL, or outdated page
Test both mobile and desktop
Run PageSpeed Insights for both device views and compare the results
Mobile is reviewed separately, not treated as a smaller desktop page
Collect field data first
Check PageSpeed Insights and Google Search Console’s Core Web Vitals report
You know whether real-user data is available and which URLs are grouped as good, needs improvement, or poor
Run repeat lab tests
Test more than once using the same tool, region, and settings
You are not making decisions from one unusually good or bad run
Record the test conditions
Save date, tool, device, network, location, and URL
Anyone can reproduce the test later
Don’t panic if one tool reports a different score from another. Look for recurring patterns: the same slow image, the same render-blocking file, the same third-party script, the same mobile issue, or the same weak TTFB.
2. Core Web Vitals checks
Core Web Vitals help you separate “the site feels slow” from the actual type of slowness visitors are experiencing.
Check
How to test it
Pass condition
Largest Contentful Paint is good
Check PageSpeed Insights, Search Console, or CrUX field data
LCP is 2.5 seconds or less at the 75th percentile
The LCP element is known
Use PageSpeed Insights, Lighthouse, or Chrome DevTools to identify the main LCP element
You know whether the delay comes from a hero image, heading, banner, product image, video poster, or other element
Interaction to Next Paint is good
Use field data and test key taps, clicks, menus, filters, forms, and buttons
INP is 200 milliseconds or less and the page responds quickly during real tasks
Cumulative Layout Shift is good
Watch the page load and check CLS in field or lab tools
CLS is 0.1 or less and visible elements do not jump after the visitor starts reading or tapping
The failing metric has a matching fix path
Map the weak metric to the likely layer
LCP fixes are not confused with INP fixes, and layout shift fixes are not treated as server fixes
For LCP, look at server response, the main image, render-blocking CSS, font loading, and whether the largest element is discovered early by the browser. As for INP, look at JavaScript execution, event handlers, third-party scripts, and long tasks on the main thread. For CLS, look at missing image dimensions, ad slots, injected banners, web fonts, embeds, and late-loading content.
3. Server response, hosting, and redirects
Before the browser can render a page, it needs the first response. A slow first response creates a low ceiling for every other improvement.
Check
How to test it
Pass condition
TTFB is within range
Use PageSpeed Insights, WebPageTest, server logs, or browser DevTools
TTFB is around 0.8 seconds or less for key pages
Redirect chains are removed
Test HTTP, HTTPS, www, non-www, trailing slash, and campaign URLs
Each path reaches the final URL with the fewest reasonable redirects
Hosting can handle the page
Compare cached and uncached page response times
The origin server does not become slow whenever cache is bypassed
Database queries are not delaying pages
Review slow query logs, CMS diagnostics, or host-level performance data
Key templates do not depend on slow queries or overloaded database calls
DNS and TLS are not creating avoidable delay
Use WebPageTest, DevTools, or your DNS provider’s tools
DNS lookup and TLS handshake times are not consistently dragging down first response
If TTFB is repeatedly weak, check hosting before you spend days shaving a few kilobytes from images. A slow origin, uncached dynamic pages, bad database behavior, or overloaded shared hosting can keep the site slow even after front-end cleanup.
If hosting is part of the problem, our guide to choosing a hosting service can help you review the decision without looking only at monthly price.
4. Caching, compression, and CDN delivery
Once the server can respond well, check whether your site is sending and reusing files efficiently.
Check
How to test it
Pass condition
Page caching is active where appropriate
Test logged-out pages and review cache headers or plugin/CDN status
Static or mostly static pages are served from cache instead of rebuilt on every request
Browser caching headers are set
Inspect headers for images, CSS, JavaScript, fonts, and other static files
HTML, CSS, JavaScript, JSON, and SVG files are compressed before delivery
CDN delivery is working
Confirm static assets are served from the CDN and cache hits are happening
Visitors far from the origin get files from edge locations when possible
Cache changes are tested after updates
Clear cache after edits, plugin changes, theme changes, or deploys
Visitors avoid stale layouts, old scripts, or broken cached assets
Caching is especially useful for WordPress and other CMS-driven sites because the server may otherwise rebuild the page for every visitor. If this is an area you need to explain to a client or team member, our website caching guide covers the basics.
5. Image and media checks
Images are often the heaviest visible assets on a page. They also frequently become the Largest Contentful Paint element.
Check
How to test it
Pass condition
Images are sized for their display area
Compare intrinsic image dimensions with rendered dimensions in DevTools
The browser is not downloading a 4000-pixel file to display an 800-pixel image
Modern formats are used where suitable
Review image file types and CMS image settings
WebP or AVIF is used when it preserves quality and browser support is acceptable
Responsive images are available
Inspect srcset and sizes attributes
Phones receive smaller assets than large desktop screens
Above-the-fold images are not lazy loaded by mistake
Review the main hero, product image, or LCP image
The browser discovers the primary image early
Below-the-fold images are lazy loaded
Inspect image loading behavior
Offscreen images do not compete with the initial render
Video and embeds do not load too early
Test pages with YouTube, Vimeo, maps, demos, or autoplay elements
Heavy embeds use posters, click-to-load behavior, or lazy loading where possible
Don’t reduce image quality so aggressively that the page looks cheap or untrustworthy. The goal is to send the right image at the right size, not to make every visual look compressed.
6. CSS, JavaScript, fonts, and rendering
A page can have lightweight images and still feel slow if the browser is blocked by CSS, JavaScript, or font behavior.
Check
How to test it
Pass condition
Render-blocking CSS is limited
Run Lighthouse or PageSpeed Insights and inspect critical CSS warnings
Above-the-fold content can render without waiting on unnecessary styles
Non-critical JavaScript is deferred or delayed
Inspect script tags, plugin settings, and waterfall charts
Scripts that are not needed for initial rendering avoid blocking parsing
Unused CSS and JavaScript are reviewed
Use Chrome DevTools Coverage and Lighthouse diagnostics
Old theme, plugin, or feature code is not bloating key pages
Long main-thread tasks are reduced
Record the page in Chrome DevTools Performance panel
Interactions are not delayed by heavy scripts or expensive event handlers
Font loading does not cause delay or layout shift
Check font requests, fallback behavior, and CLS
Fonts are limited, subset where possible, and loaded without visible jumps
JavaScript deserves special attention because it is expensive for the browser. It has to be downloaded, parsed, compiled, and executed. On a slower phone, a script that feels harmless on desktop can make menus, forms, filters, and checkout steps feel sluggish.
7. Third-party script checks
Analytics, ad tags, heatmaps, chat widgets, social embeds, A/B testing tools, review widgets, booking tools, and personalization scripts can all add useful functions. They can also make a fast page slow.
Check
How to test it
Pass condition
Every third-party script has an owner
List all external domains loaded on key pages
Each script has a business purpose and someone responsible for it
Unused tools are removed
Compare loaded scripts with tools the team actually uses
Old tags, abandoned pixels, unused chat tools, and inactive experiments are gone
Heavy scripts are delayed where possible
Use waterfall charts, PageSpeed Insights, and WebPageTest blocking tests
Nonessential scripts avoid blocking the first render or primary conversion path
Consent and privacy tools are tested
Test first visit, accepted consent, rejected consent, and repeat visit
The consent setup does not break performance, analytics, forms, or layout
The impact is measured before and after removal
Block one third-party domain at a time in WebPageTest or DevTools
You know which scripts carry the largest performance cost
This is one of the fastest places to find avoidable drag. A site can collect years of marketing tags that nobody uses anymore. If a script is not helping the visitor or the business, it should not get a free ride on every page load.
8. Mobile performance and usability checks
Mobile testing is not just desktop testing on a narrow screen. Visitors on mobile often have slower networks, less powerful processors, smaller screens, touch input, and more interruptions.
Check
How to test it
Pass condition
The mobile score is reviewed separately
Run mobile and desktop tests in PageSpeed Insights
You are not using a strong desktop result to excuse a weak mobile experience
Layout works at common widths
Test small phones, large phones, tablets, and orientation changes
Text, menus, images, buttons, and forms reflow without horizontal scrolling
Tap targets are large enough
Use Lighthouse tap target checks and test on a real phone
Buttons and links are easy to tap without hitting the wrong element
Sticky elements do not crowd the screen
Test cookie banners, chat buttons, headers, bottom bars, and popups
Visitors can read and act without the interface blocking the page
Forms are usable on touch screens
Submit forms on a real phone
Inputs, labels, keyboards, error messages, and submit buttons work without friction
Security choices can affect performance. They can also affect whether visitors trust the page enough to stay.
Check
How to test it
Pass condition
HTTPS works across the whole site
Open key templates, assets, forms, and redirects
Every public page loads over HTTPS with a valid certificate
Mixed content is removed
Inspect browser console warnings and asset URLs
Images, scripts, styles, fonts, and embeds do not load over plain HTTP
HTTP/2 or HTTP/3 is supported
Check protocol in DevTools Network panel or WebPageTest
The server is not limited to old HTTP/1.1 delivery for modern browsers
Security warnings are absent
Test certificate, domain, and browser warnings
Visitors are not blocked by expired certificates or unsafe resource warnings
Uptime and SSL monitoring are active
Review monitoring setup
The team gets alerts before users become the monitoring system
If HTTPS or certificate setup is weak, fix that before fine-tuning speed scores. Our guide on how to secure a website covers the broader trust and protection side.
10. Conversion path checks
Performance testing should include the pages where visitors actually do something. A page can score well in a generic test and still lose people during a form, checkout, booking, or account step.
Check
How to test it
Pass condition
Forms submit correctly
Test contact, quote, newsletter, lead magnet, and account forms
Submissions work, confirmation messages appear, and notifications arrive
Checkout or booking flows complete
Run a test order or booking in a safe mode
Shipping, payment, tax, discount, confirmation, and notification steps work
Search, filters, and menus respond quickly
Test common interactions on mobile and desktop
Interactive elements do not feel delayed or broken
Error states are clear
Enter invalid fields and trigger likely mistakes
Visitors can recover without guessing what went wrong
Analytics events still fire
Check GA4, tag manager, ad platform events, or CRM tracking
Conversion measurement survives the performance fixes
This is where performance work connects to revenue. Don’t stop at “the page loads.” Test whether a visitor can complete the task that page exists to support.
11. Load, campaign, and spike-readiness checks
Regular speed testing tells you how a page behaves under normal conditions. It doesn’t always tell you what happens during a launch, sale, email blast, viral mention, ad push, or seasonal spike.
Check
How to test it
Pass condition
Expected traffic spikes are planned
Review upcoming campaigns, sales, PR, and email sends
Hosting, CDN, cache, and checkout capacity match the event risk
Load testing is done for high-value events
Use a controlled load-testing tool or hosting-supported test
The site stays available and responsive under expected load
Cache warmup is planned
Preload key pages before launches or major campaigns
Visitors do not all hit uncached pages at once
Rollback steps are documented
Review the deploy and plugin update process
The team knows how to reverse a change if performance breaks
Support contacts are current
Confirm hosting, developer, CDN, payment, and plugin contacts
The right people can respond quickly if the site slows or fails
Small sites don’t always need formal load testing every month. But if a campaign depends on the website staying fast, test before the traffic arrives.
The fastest way to prioritize fixes
If the checklist produces a long fix list, don’t start randomly. Use the weak metric to choose the first layer to inspect.
Real devices, real connection mix, third-party timing
Search Console URL groups and CrUX history
Fix the largest business-risk issue first. A slow checkout, broken booking flow, or weak mobile service page usually deserves attention before a low-traffic article with the same score.
Best tools for website performance testing
No single tool tells the whole story. Use a small tool stack and give each tool a job.
Tool
Best use
Google PageSpeed Insights
Core Web Vitals, field data, Lighthouse diagnostics, mobile and desktop comparison
Google Search Console Core Web Vitals report
Site-level URL groups based on real-user CrUX data
Repeatable tests by location, device, connection, filmstrip, waterfall, and third-party blocking
GTmetrix
Waterfall reviews, visual reports, history, and monitoring
Real User Monitoring tools
Ongoing performance data from actual visitors
Hosting and CDN dashboards
Cache status, origin response, edge behavior, bandwidth, errors, and uptime
For small sites, PageSpeed Insights, Search Console, and Chrome DevTools are enough to start. For ecommerce, high-traffic publishing, SaaS, memberships, or campaign-heavy sites, add monitoring and controlled testing before major traffic events.
How often should you test website performance?
Testing frequency depends on how often the site changes and how much business the site supports.
Frequency
What to test
Weekly
Uptime alerts, obvious page errors, key forms, checkout or booking if applicable
Monthly
Core Web Vitals, top landing pages, page speed, Search Console groups, third-party scripts, image weight
Before campaigns
Landing pages, checkout/forms, tracking, cache, CDN, load risk, mobile experience
Deeper audit of templates, page weight, old scripts, unused code, mobile UX, monitoring setup
Performance isn’t a one-time launch task. New content, new scripts, plugin updates, tracking changes, fonts, embeds, videos, and design edits can all make a site slower over time.
If your site runs on WordPress and performance problems keep returning after updates, a recurring website maintenance service may be more useful than repeating one-off fixes.
Common mistakes to avoid
The checklist works best when you avoid the traps that make performance work look busier than it is.
Mistake
Better approach
Chasing a perfect Lighthouse score
Fix issues that affect real users and business-critical pages first
Testing only the homepage
Test top landing pages, conversion pages, and mobile-heavy pages
Trusting one test run
Repeat tests and compare field data with lab data
Compressing images until they look bad
Serve the right dimensions and format while preserving visual quality
Removing scripts without checking tracking
Confirm analytics, ads, consent, forms, and CRM events still work
Ignoring mobile because desktop looks good
Treat mobile as its own performance environment
Fixing symptoms before TTFB
Check server response, cache, redirects, and hosting early
Publishing changes without retesting
Test after every meaningful fix
Good performance work is usually practical, not dramatic. Measure the page, identify the weak layer, fix the cause, retest, and keep watching.
Start with the page where slowness costs the most
You don’t need to fix every page at once. Start with the page where speed has the clearest business cost.
For many businesses, that means a service page, product page, checkout, booking page, contact form, or high-traffic organic landing page. Run the page through the checklist, record the failures, make the highest-impact fixes, and retest under the same conditions.
Then repeat the process on the next page.
If you want a starting point without building the whole audit yourself, run Tech Help Canada’s free Website Health Report. It checks performance, security, SEO, accessibility, and related site-health signals so you can see where the site needs attention first.
Frequently asked questions
What is website performance testing?
Website performance testing measures how fast, stable, responsive, and usable a website feels for visitors. It usually includes Core Web Vitals, server response, page weight, images, scripts, caching, mobile usability, forms, checkout or booking flows, and ongoing monitoring.
What should a website performance testing checklist include?
A useful checklist should cover measurement setup, Core Web Vitals, TTFB, hosting, redirects, caching, compression, CDN delivery, images, media, CSS, JavaScript, third-party scripts, mobile usability, HTTPS, forms, conversion paths, load risk, and monitoring.
What are good Core Web Vitals scores?
Google’s good thresholds are Largest Contentful Paint at 2.5 seconds or less, Interaction to Next Paint at 200 milliseconds or less, and Cumulative Layout Shift at 0.1 or less. These are assessed at the 75th percentile of real-user visits when field data is available.
Is PageSpeed Insights enough to test website performance?
PageSpeed Insights is a strong starting point because it combines Lighthouse lab diagnostics with Chrome UX Report field data when enough real-user data exists. For deeper testing, pair it with Search Console, Chrome DevTools, WebPageTest, GTmetrix, server logs, CDN data, and real-user monitoring.
How often should you test website performance?
Review key pages at least monthly, and test again after major theme, plugin, hosting, tracking, design, or content changes. Also test before campaigns, sales, launches, or seasonal traffic spikes so slow pages do not become a surprise during the moment that matters.
What should you fix first when a website is slow?
Start with the page where slowness has the clearest business cost, then match the fix to the failing metric. LCP problems often point to server response, images, CSS, or fonts. INP problems often point to JavaScript or third-party scripts. CLS problems usually point to layout, images, ads, embeds, or late-loading content.
Tech Help Canada Staff researches, writes, and reviews practical content for business owners and professionals. Our coverage spans business, marketing, SEO, technology, and the tools and systems people use to grow and operate online. We focus on clear, useful information backed by research, hands-on experience, and editorial review. Learn more about our team and editorial standards. Need help with something? Contact Us